wannier interpolation worsens with k-point density
Moderators: MMNSchmitt, gonze
wannier interpolation worsens with k-point density
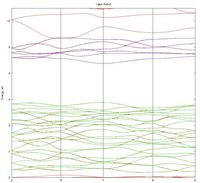
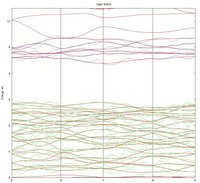
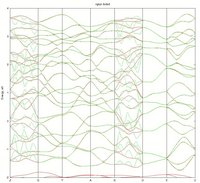
I tried to calculate a Wannier interpolated band structure for CdWO4 but I get unexpected behaviour. With 2x2x2 k-point sampling the agreement with the regular full band structure calculation is poor, with 3x3x3 the result is pretty good and with 4x4x4 I consider the calculation well converged. Now if I try 5x5x5 I get an oscillatory behaviour and with 6x6x6 it gets even worse. The total spread of Wannier functions is about 4 times higher with 5x5x5 and 6x6x6 k-point mesh compared to 4x4x4. Is there a physical basis for why I should get worse results with denser k-point sampling?
CdWO4 has a monoclinic lattice with 12 atoms in the unit cell. I first do a scf calculation, followed by nscf, which looks like this:
----------------------------------------------------------------------------
acell 9.4719010513 11.133835647 9.5715494332
angdeg 90 91.1689443630025 90
ntypat 3
znucl 48 74 8
natom 12
typat 1 1 2 2 3 3 3 3 3 3 3 3
xred
0.500000000000 0.311514213089 0.750000000000
-0.500000000000 -0.311514213089 -0.750000000000
0.000000000000 0.175217256055 0.250000000000
0.000000000000 -0.175217256055 -0.250000000000
0.244299075739 0.368497627193 0.384328511082
-0.244299075739 -0.368497627193 -0.384328511082
0.244299075739 -0.368497627193 0.884328511082
-0.244299075739 0.368497627193 -0.884328511082
0.201010376569 0.096671554828 0.945575992814
-0.201010376569 -0.096671554828 -0.945575992814
0.201010376569 -0.096671554828 1.445575992814
-0.201010376569 0.096671554828 -1.445575992814
ngkpt 3*4
nshiftk 1
shiftk 3*0
nband 70
ecut 16
pawecutdg 50
tolwfr 1d-10
nstep 50
iscf -2
istwfk *1
kptopt 3
diemac 2.5
irdwfk 1
prtwant 2
w90prtunk 1
----------------------------------------------------------------------------
This is my wannier90.win:
----------------------------------------------------------------------------
num_wann 24
num_iter 100
exclude_bands : 1-34, 59-70
num_bands 24
bands_plot = .true.
begin kpoint_path
Z 0 0 0.5 G 0 0 0
G 0 0 0 Y 0 0.5 0
Y 0 0.5 0 A -0.5 0.5 0
A -0.5 0.5 0 B -0.5 0 0
B -0.5 0 0 D -0.5 0 0.5
D -0.5 0 0.5 E -0.5 0.5 0.5
E -0.5 0.5 0.5 C 0 0.5 0.5
end kpoint_path
----------------------------------------------------------------------------
For conduction bands I have a similar input file except for
num_wann 6
exclude_bands : 1-58, 66-70
num_bands 7
dis_froz_max 8.5
I attached the results of using ngkpt 3*2, 3*4 and 3*6 (3 attachments is the maximum). Solid line is a full band structure calculation, dashed line is Wannier interpolation.
Looking forward to any help/ideas.
Raul Laasner
Netherlands Institute for Space Research
Netherlands Institute for Space Research
Re: wannier interpolation worsens with k-point density
Hi,
Doing a successful wannier90 run is complex. You should try different initial projections in your wannier90 input, this should help reducing the total spread of WF.
The spread is not an easy quantity to converge, the code gets 'stuck' in local minima all the time. Projections accelerate (a lot) this calculation.
Good luck, have fun!
Simon
Re: wannier interpolation worsens with k-point density
Thanks. For the valence band it's easy. For CdWO4
begin projections
O:p
begin projections
accurately describes all 24 projections. I now get better results with denser k-point meshes, although there are still some rapid oscillations along two lines in the BZ. (At least in the important region, around band maximum, the result is good.)
I'll see what I can do for conduction bands.
begin projections
O:p
begin projections
accurately describes all 24 projections. I now get better results with denser k-point meshes, although there are still some rapid oscillations along two lines in the BZ. (At least in the important region, around band maximum, the result is good.)
I'll see what I can do for conduction bands.
Raul Laasner
Netherlands Institute for Space Research
Netherlands Institute for Space Research
Re: wannier interpolation worsens with k-point density
When you rise the number of k-points you should tune also the energy windows.
You could also rise the number of iterations to minimize the spread (in the .win file).
At the end, you should find Wannier functions with a very small spread to do a good interpolation.
You could also rise the number of iterations to minimize the spread (in the .win file).
At the end, you should find Wannier functions with a very small spread to do a good interpolation.
Tonatiuh Rangel
Re: wannier interpolation worsens with k-point density
For the conduction band I tried
and got better results. The conduction band interpolation seems to be converged at 4x4x4. The valence band is also converged at 4x4x4 in the region of interest, as I already mentioned. The erratic behaviour at ZG and BD lines disappears at ngkpt 7x7x7. But for GW calculations I probably won't go as far as 7x7x7.
I haven't tried different energy windows yet.
This is my grep CONV wannier.wout for the valence band with 24 MLWFs,
and for the conduction band with 6 MLWFs,
I don't have much experience with Wannier functions so I'm not sure if these spreads can be considered small or not.
Code: Select all
begin projections
  W:l=2,mr=1
  W:l=2,mr=2
  W:l=2,mr=3
end projections
and got better results. The conduction band interpolation seems to be converged at 4x4x4. The valence band is also converged at 4x4x4 in the region of interest, as I already mentioned. The erratic behaviour at ZG and BD lines disappears at ngkpt 7x7x7. But for GW calculations I probably won't go as far as 7x7x7.
I haven't tried different energy windows yet.
This is my grep CONV wannier.wout for the valence band with 24 MLWFs,
Code: Select all
+--------------------------------------------------------------------+<-- CONV
 | Iter  Delta Spread     RMS Gradient      Spread (Ang^2)      Time  |<-- CONV
 +--------------------------------------------------------------------+<-- CONV
     ...
     95    -0.208E-03     0.0146185153       57.7206196866    3797.56  <-- CONV
     96    -0.182E-03     0.0141738224       57.7204379174    3798.55  <-- CONV
     97    -0.177E-03     0.0196854082       57.7202608225    3799.55  <-- CONV
     98    -0.208E-03     0.0140305753       57.7200532422    3800.54  <-- CONV
     99    -0.182E-03     0.0147312550       57.7198709055    3801.53  <-- CONV
    100    -0.164E-03     0.0134562756       57.7197064103    3802.53  <-- CONV
and for the conduction band with 6 MLWFs,
Code: Select all
     ...
     95    -0.894E-08     0.0001325463       23.6471196061    2188.69  <-- CONV
     96    -0.723E-08     0.0001106961       23.6471195988    2188.76  <-- CONV
     97     0.478E-08     0.0000700870       23.6471196036    2188.84  <-- CONV
     98    -0.188E-07     0.0002473607       23.6471195848    2188.92  <-- CONV
     99    -0.425E-08     0.0000785548       23.6471195806    2188.99  <-- CONV
    100    -0.819E-08     0.0000564535       23.6471195724    2189.07  <-- CONV
I don't have much experience with Wannier functions so I'm not sure if these spreads can be considered small or not.
Raul Laasner
Netherlands Institute for Space Research
Netherlands Institute for Space Research
Re: wannier interpolation worsens with k-point density
One more question. What are the units of the Wannier functions produced by setting wannier_plot true and using the xsf format? If I set isovalue = 1 in xcrysden, does that correspond to 1/Angstrom^1.5?
Raul Laasner
Netherlands Institute for Space Research
Netherlands Institute for Space Research
Re: wannier interpolation worsens with k-point density
The final spreads that you obtain are quite big, one should obtain on the order of 1 ang^2, at max 10,
For the valence bands, the algorithm generally finds a good set of Wannier functions.
To obtain good Wannier functions from the conduction bands is quite hard.
The difficulty comes from the fact that electrons start to be dellocalized, and sometimes we don't know the shape of the molecular orbitals.
One method to get physical Wannier functions is to identify a set of isolated many-folds.
And do different calculations for each of them.
For this you have to identify the chemical character of the orbitals, bonding, etc, and
give a very precise initial guess. This can be quite hard to do.
On the other hand, there are some methodologies you could try, if you only want to interpolate the eigenvalues.
However, the Wannier functions will not be physical (they will not correspond to molecular or atomic orbitals of your system)
1) you can try to get both, the conduction and valence bands at the same time,
this sometimes works better.
Here you should try a highly symmetrical initial guess, even if it is not physical.
For example, if you have s and p orbitals, you could try sp3, even if these are not physical.
In general, sp3 are more localized than s or p orbitals, so that artifially mixing them will help obtaining localized Wannier functions.
2) You could add a big number of Wannier functions, and a bigger number of bands.
For this, you can try a highly symmetrical initial guess, and include some random wannier functions.
With a big number of iterations (thousands), the procedure should find some localized Wannier functions, which do not correspond to molecular orbitals, of course.
But, these can be used to interpolate.
Tonatiuh Rangel
Re: wannier interpolation worsens with k-point density
Thanks for the advice. I added valence and conduction bands together, and got 60.31 Ang^2, although interpolation was worse.
With valence and conduction bands separately, I tried ngkpt 8x8x8, num_iter 2000, and got absolutely perfect agreement between interpolated and calculated band structures, even though the total spread was still 57 Ang^2 for the valence band, i.e. 2.4 Ang^2 per MLWF. I also tried to include bands from the next highest valence band into the disentanglement procedure, but with no difference at ngkpt 4x4x4. Then I added the entire second valence and specified 34 initial guesses with O:p Cd:d. Total spread was down to 34.6 Ang^2, but I still get the same oscillations along ZG and BD lines. Also, I'm not sure if I can use sp3 projections for the highest valence band. Specifying O:sp3 would give me 32 projections, more than is required. Which O atoms do I leave out then? From DOS calculations it is clear that the highest valence band is dominated by O 2p orbitals. I'll see what else I can do. Perhaps play more with the energy windows.
In the end, If I can accurately interpolate the band structure, I don't see why is it necessary to get a small total spread. My goal is to eventually calculate the quasiparticle band structure.
Raul Laasner
Netherlands Institute for Space Research
Netherlands Institute for Space Research
Re: wannier interpolation worsens with k-point density
Of course each system is different.
To obtain good Wannier functions there is not a simple recipy, one has to try several times.
Localized Wannier functions (with small spread) are needed to make a good interpolation.
If you have large spreads, the interpolated bandstructure may have unphysical flutuations.
To obtain good Wannier functions there is not a simple recipy, one has to try several times.
Localized Wannier functions (with small spread) are needed to make a good interpolation.
If you have large spreads, the interpolated bandstructure may have unphysical flutuations.
Tonatiuh Rangel


