Note
Click here to download the full example code or to run this example in your browser via Binder
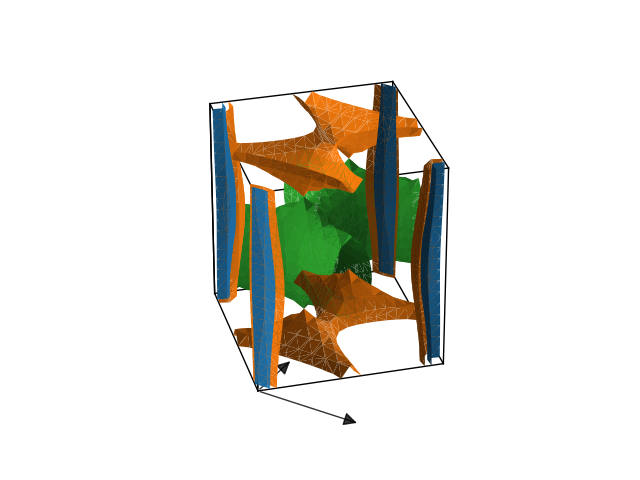
MgB2 Fermi surface
This example shows how to plot the Fermi surface with matplotlib
Out:
<Figure size 640x480 with 1 Axes>
from abipy import abilab
import abipy.data as abidata

with abilab.abiopen(abidata.ref_file("mgb2_kmesh181818_FATBANDS.nc")) as fbnc_kmesh:
    ebands = fbnc_kmesh.ebands

# Build ebands in full BZ.
eb3d = ebands.get_ebands3d()

# Use matplotlib to plot isosurfaces corresponding to the Fermi level (default)
# Warning: requires skimage package, rendering could be slow.
eb3d.plot_isosurfaces()

# Alternatively, it's possible to export the data in xcrysden format
# and then use `xcrysden --bxsf mgb2.bxsf`
#eb3d.to_bxsf("mgb2.bxsf")

# If you have mayavi installed, try:
#eb3d.mvplot_isosurfaces()
Total running time of the script: ( 0 minutes 0.376 seconds)