Hello everyone
I have followed the lesson 3 in the tutorial(given in the abinit) for the calculation of band structure for TiS2. I am also given the command (prtdos2 1) in the input file for the calculation of density of states for the same k-points as the band structure calculations.
I am getting the band structure information in the out file. However I am not getting the correct density of states values (tis2o_DS2_DOS). I have compared the band structure and density of states with others.
Band structure is OK. But the nature and locations of the peaks are not matching for the DOS.
Further, in the DOS file (tis20_DS2_DOS), fermi energy is showing zero. Is it correct.
Anyone have some idea or suggestions please help.
thanks in advance
Ashish
band st and DOS for the same k-points
Moderator: bguster
Re: band st and DOS for the same k-points
Dear Ashish,
Just before anything else, is the Fermi level at the same energy position for both band structure and DOS when you compare the two?
Best wishes,
Eric
Just before anything else, is the Fermi level at the same energy position for both band structure and DOS when you compare the two?
Best wishes,
Eric
Re: band st and DOS for the same k-points
Thanks for the response
In tis2o_DS2_DOS file Fermi energy = 0.00 Ha whereas in tis2o_DS1_DOS file Fermi energy is 0.068 Ha. Therefore, fermi energy taken as zero for the DOS.
That is also I have doubt why it is showing Zero.
Finally the values given in tis2o_DS2_DOS, I have plotted in eV and compared with others.
Ashish
In tis2o_DS2_DOS file Fermi energy = 0.00 Ha whereas in tis2o_DS1_DOS file Fermi energy is 0.068 Ha. Therefore, fermi energy taken as zero for the DOS.
That is also I have doubt why it is showing Zero.
Finally the values given in tis2o_DS2_DOS, I have plotted in eV and compared with others.
Ashish
Re: band st and DOS for the same k-points
Dear Ashish,
OK, then to compare the two, I guess it'll be better that you have the Fermi level at the same place, i.e. for convenience to have the Fermi level at zero for the band structure too by adding a shift of 0.068 Ha on the energy.
Which tools are you using to plot the DOS and band structure?
All the best,
Eric
Re: band st and DOS for the same k-points
Dear Ebousquet
Thank you for your response
The fermi energy 0.068 Ha is for data set1. I am running band structure for data set 2. so I have to compare band structure and DOS from data set 2.
I feel if I am able to run DOS separately with the same k-points used in band structure. Then also we can compare both of them.
However, when I am trying to run DOS separately giving the k-points used for the band structure. It comes out having error in log file which says that the number of k points is automatically generated by using kptopt, kptrlatt, shift k.
Therefore, I reduced the no of k-points so that it matches the no. of k-points automatically generated.
But this also does work. I have checked in 'out'' and "log" file , it is taking the automatically generated k-points
The input variables kptopt, kptrlatt, shift k are inactive instead I have used nkpt and kpt for giving my k-points
with regards
Ashish
Re: band st and DOS for the same k-points
Dear Ashish,
I'm not sure if I understand what you are doing as calculation, can you show the input files you are using?
To do the DOS you don't necessarily need to have exactly the same mesh of k-point as for the band structure.
Best wishes,
Eric
I'm not sure if I understand what you are doing as calculation, can you show the input files you are using?
To do the DOS you don't necessarily need to have exactly the same mesh of k-point as for the band structure.
Best wishes,
Eric
Re: band st and DOS for the same k-points
Dear Ebousquet
Thank you for your response
I am sending my input file, DOS file and plot for DOS using full tsmear(columns 1:2) and half tsmear (columns 1:4). I am also sending DOS for TiS2 from one paper. The energy locations of peaks for my DOS plot is not matching with others published work.
Please give your comments/ suggestions
with regards
Ashish
- Attachments
-
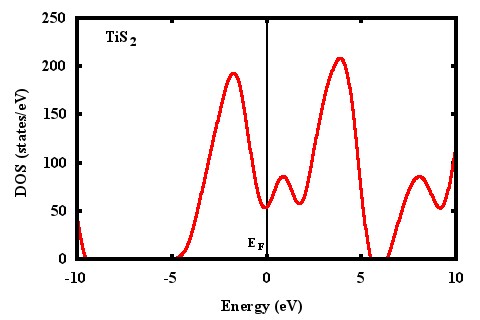
- DOS plot using 1 and 2 columns
- dos-tis2-2.jpeg (24.13 KiB) Viewed 5383 times
-
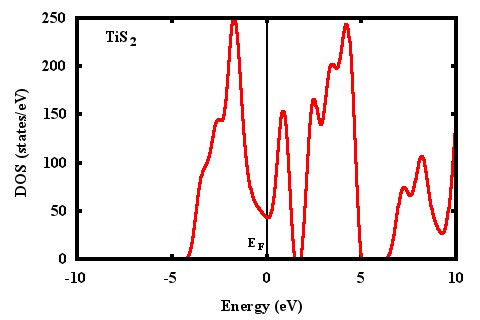
- DOS plot using 1 and 4 columns
- dos-tis2-4.jpeg (26.31 KiB) Viewed 5383 times
-
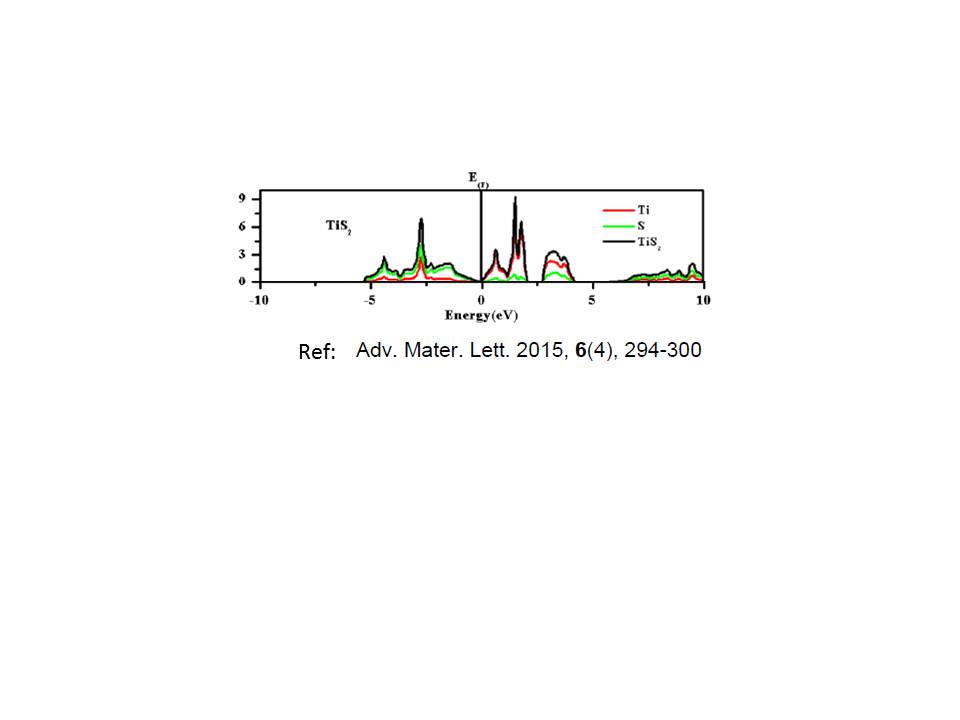
- DOS fig from other paper
- DOS-TiS2-others.jpg (22.89 KiB) Viewed 5383 times
-
- tis2in.pdf
- input file
- (37.76 KiB) Downloaded 280 times
-
- tis2o_DS2_DOS.pdf
- DOS file
- (117.04 KiB) Downloaded 255 times
Re: band st and DOS for the same k-points
Dear Ashish,
Which pseudopotentials did you use for your calculations (from pseudodojo set?)?
Sounds your system is close to be insulator, meaning that you have to check convergence with tsmear, ecut and grid of k-points (10x10x10 might not be enough), did you check?
It is also possible that you have to use DFT+U in this case and thus PAW instead of norm-conserving.
Let me know,
Eric