Dear Abinit Users
I have been trying for a while to obtain the density of states plot of graphene.
I have done the ecut and ngkpt convergence, then the optimization of atomic geometry of graphene and then tried to do density of states calculation using tetrahedron method.
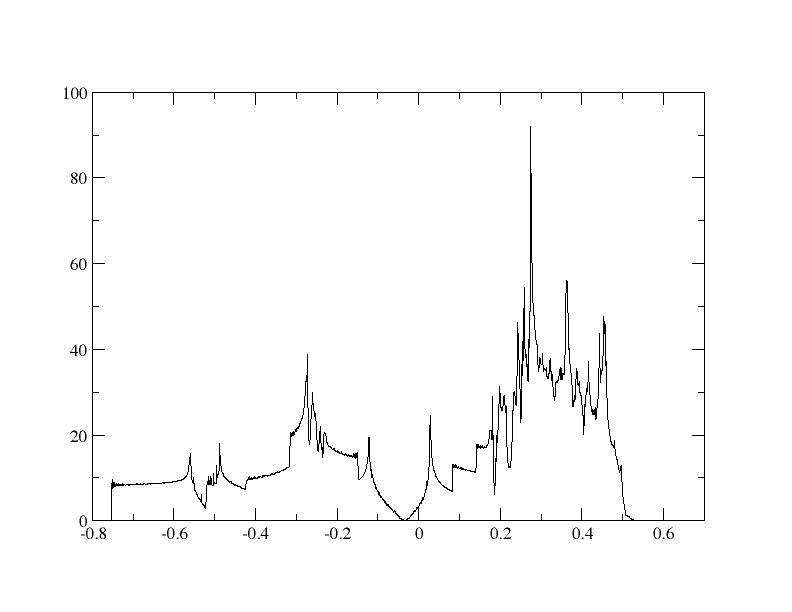
I am facing a great problem that as per the theory the dos of graphene is zero at zero energy. But I am getting a different plot where the density of states is showing zero values away from the zero energy level. The input file, the dos plot and the output file are attached herewith.
Is it necessary that ngkpt grid should contain the high symmetry points of the Briolluin zone, how can I make sure that the grid contains these points. Is it the reason for the wrong result that I obtain.
Please guide me in this regard.
For my last two posts, I didnt receive a reply from anyone.
Please help me with some comments so that I could continue.
Thanks in advance
Seba
Wrong DOS plot of graphene
Moderator: bguster
-
Seba Darshan
- Posts: 63
- Joined: Mon Feb 17, 2014 5:19 am
Re: Wrong DOS plot of graphene
May I know you perform parallel or serial calculation?
-
Seba Darshan
- Posts: 63
- Joined: Mon Feb 17, 2014 5:19 am
Re: Wrong DOS plot of graphene
sheng wrote:May I know you perform parallel or serial calculation?
Hai Sheng
Sorry for the delay in replying to the question.
I have done it in parallel using 8 processors. Does calculations in parallel can result in wrong results?
Hope to hear from you favourably
Thanks and Regards
Seba
Re: Wrong DOS plot of graphene
Two points:
1) Do DOS calculation in serial mode. I got wrong results previously using parallel mode, and if you browse through the forum you can also find people reporting about inconsistencies in its intensity.
2) Your fermi energy is -0.03430 Hartree. In your graph above did you shift your fermi energy to zero? From visual inspection, the DOS at fermi energy level is indeed zero.
-
en victory
- Posts: 2
- Joined: Mon Jan 07, 2019 2:02 pm
Re: Wrong DOS plot of graphene
Dear Seba Darshan,
I am a new user ABINIT. Have you get the solution of this problem?
Because I face same problem, but I can't get the solution.
Thank you.
I am a new user ABINIT. Have you get the solution of this problem?
Because I face same problem, but I can't get the solution.
Thank you.
Re: Wrong DOS plot of graphene
Dear en victory,
This is an old post from 2015, could you describe your problem and with which version of Abinit?
Best wishes,
Eric
This is an old post from 2015, could you describe your problem and with which version of Abinit?
Best wishes,
Eric