Note
Go to the end to download the full example code.
Band structure flow with factory functions
This example show how to build a flow to compute the band structure and the DOS of silicon. Input files are automatically generated with factory functions designed for automatic calculations.
import os
import sys
import abipy.data as abidata
from abipy import abilab, flowtk
def build_flow(options):
# Working directory (default is the name of the script with '.py' removed and "run_" replaced by "flow_")
if not options.workdir:
options.workdir = os.path.basename(sys.argv[0]).replace(".py", "").replace("run_", "flow_")
# Initialize structure and pseudos.
structure = abilab.Structure.from_file(abidata.cif_file("si.cif"))
pseudos = abidata.pseudos("14si.pspnc")
# Initialize the flow.
flow = flowtk.Flow(workdir=options.workdir, manager=options.manager)
# Use the ebands_input factory function to build a MultiDataset.
# keyword args are optional (default values are given or computed automatically, see docs).
multi = abilab.ebands_input(
structure, pseudos, kppa=40, dos_kppa=80, nscf_nband=6, ndivsm=10, ecut=6, spin_mode="unpolarized"
)
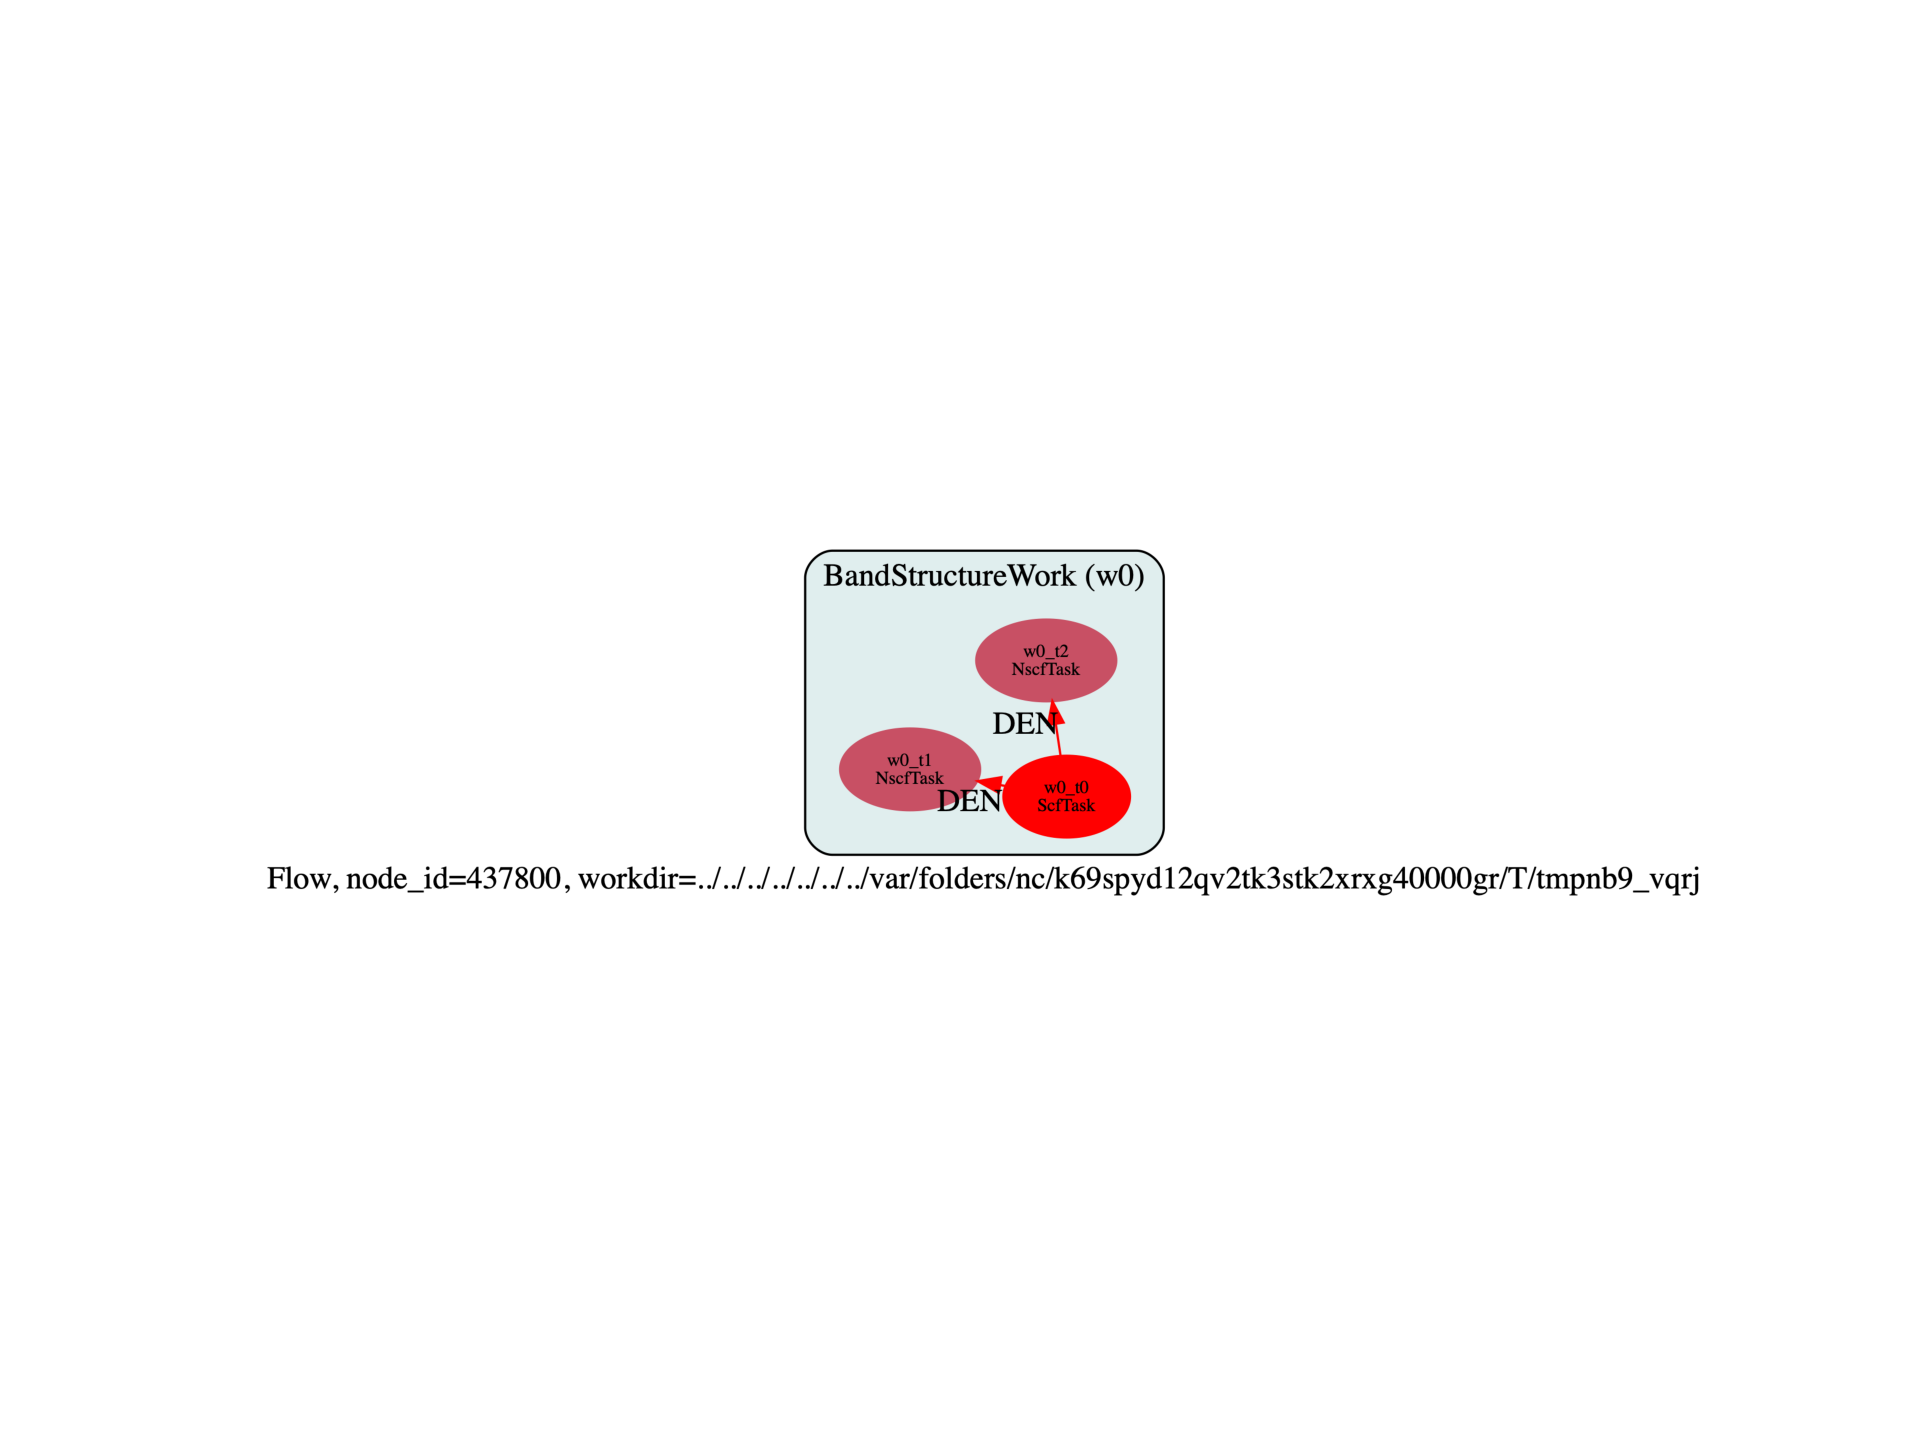
work = flowtk.BandStructureWork(scf_input=multi[0], nscf_input=multi[1], dos_inputs=multi[2])
flow.register_work(work)
return flow
# This block generates the thumbnails in the AbiPy gallery.
# You can safely REMOVE this part if you are using this script for production runs.
if os.getenv("READTHEDOCS", False):
__name__ = None
import tempfile
options = flowtk.build_flow_main_parser().parse_args(["-w", tempfile.mkdtemp()])
build_flow(options).graphviz_imshow()
@flowtk.flow_main
def main(options):
"""
This is our main function that will be invoked by the script.
flow_main is a decorator implementing the command line interface.
Command line args are stored in `options`.
"""
return build_flow(options)
if __name__ == "__main__":
sys.exit(main())
Run the script with:
run_hs_si_ebands.py -s
Use:
abirun.py flow_h_si_ebands deps
To print the connections among the tasks.
<ScfTask, node_id=241095, workdir=flow_ht_si_ebands/w0/t0>

<NscfTask, node_id=241096, workdir=flow_ht_si_ebands/w0/t1>
  +--<ScfTask, node_id=241095, workdir=flow_ht_si_ebands/w0/t0>

<NscfTask, node_id=241097, workdir=flow_ht_si_ebands/w0/t2>
  +--<ScfTask, node_id=241095, workdir=flow_ht_si_ebands/w0/t0>
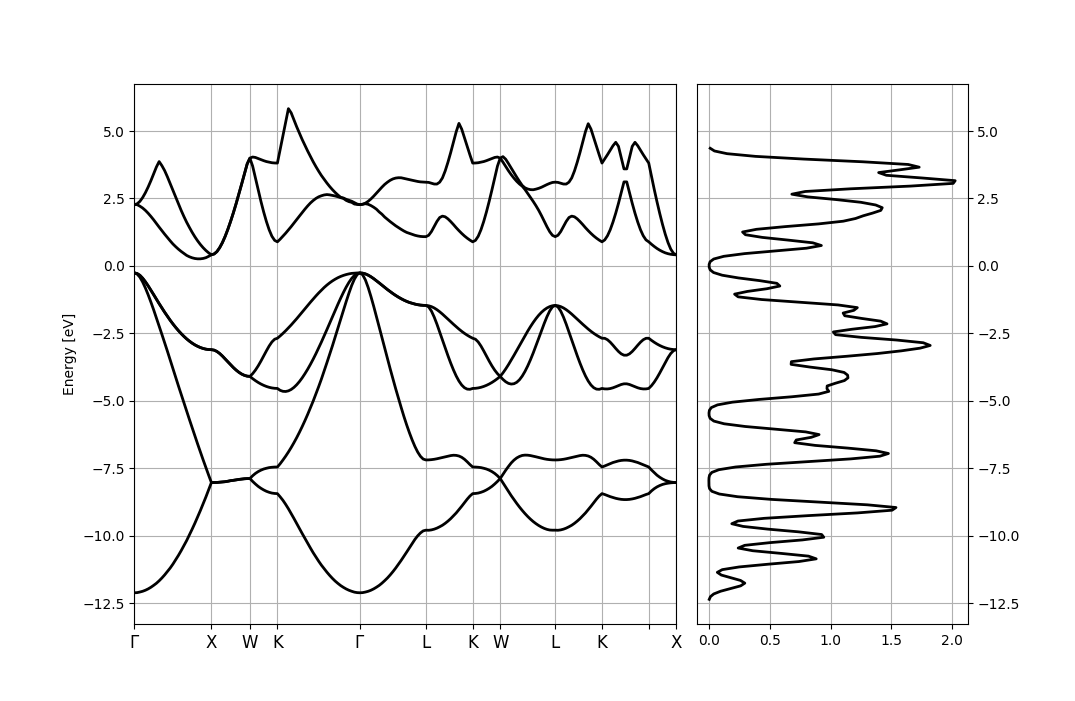
w0/t1is a band structure calculation along a k-pathwhile
w0/t2produced KS eigenvalues in the IBZ for the DOS.You can use ipython to plot the electronic bands with the DOS:
In [1]: %matplotlib
In [2]: from abipy import abilab
In [3]: gsr_kpath = abilab.abiopen("flow_ht_si_ebands/w0/t1/outdata/out_GSR.nc")
In [4]: gsr_kmesh = abilab.abiopen("flow_ht_si_ebands/w0/t2/outdata/out_GSR.nc")
In [5]: gsr_kpath.ebands.plot_with_edos(gsr_kmesh.ebands.get_edos())
Total running time of the script: (0 minutes 0.365 seconds)