Note
Go to the end to download the full example code.
Relaxation flow
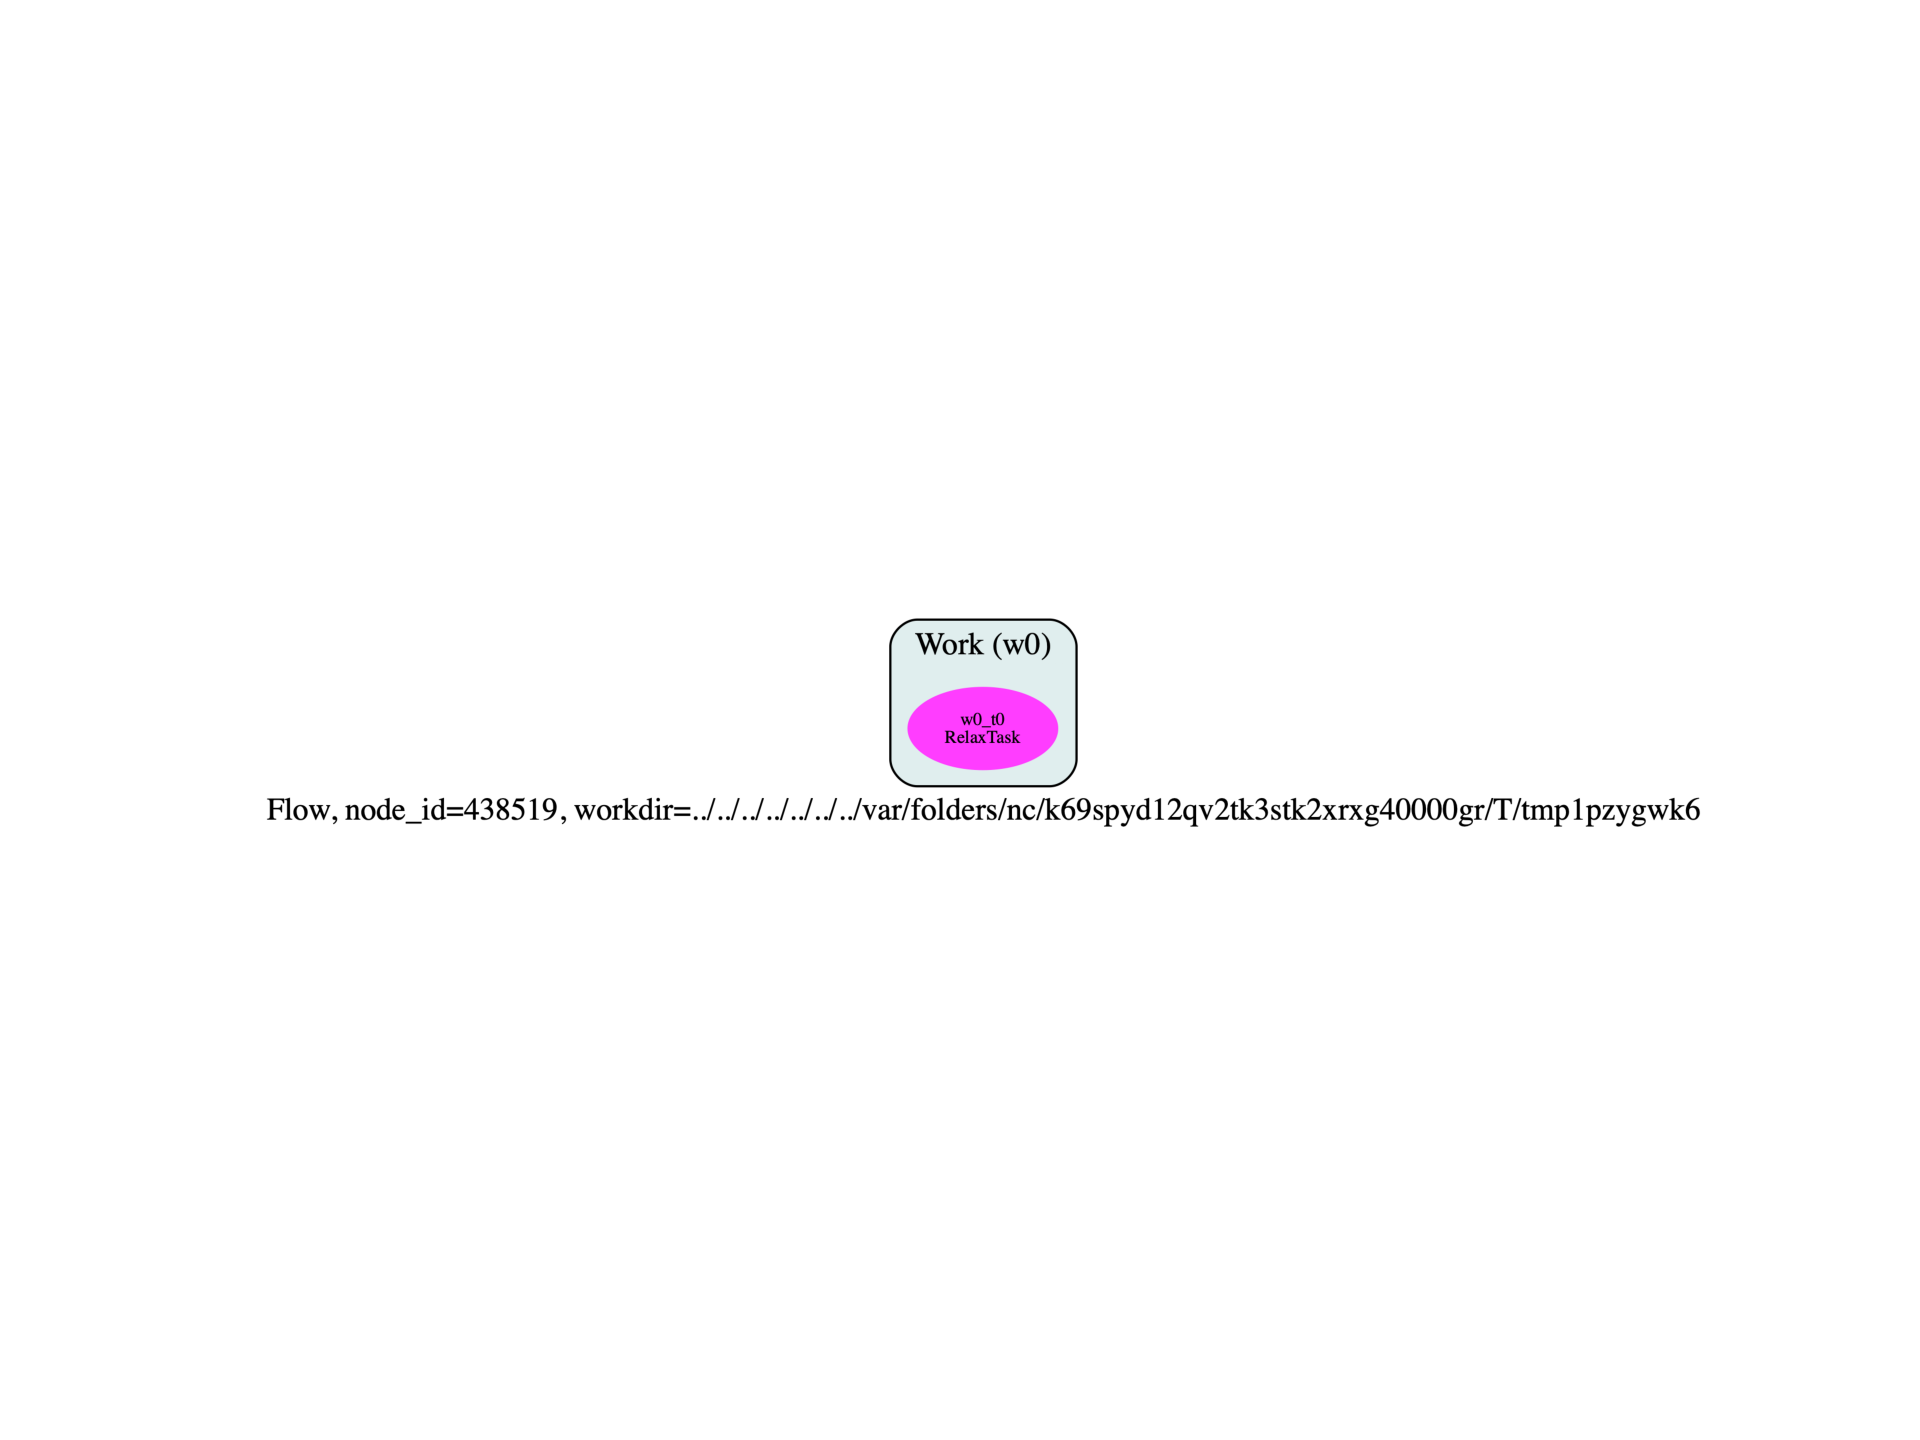
This example shows how to build a very simple Flow for the structural relaxation of SiC. One could use a similar logic to perform multiple relaxations with different input parameters.
import sys
import os

import abipy.abilab as abilab
import abipy.data as data
import abipy.flowtk as flowtk


def build_flow(options):
    # Working directory (default is the name of the script with '.py' removed and "run_" replaced by "flow_")
    if not options.workdir:
        options.workdir = os.path.basename(sys.argv[0]).replace(".py", "").replace("run_", "flow_")

    pseudos = data.pseudos("14si.pspnc", "6c.pspnc")
    structure = data.structure_from_ucell("SiC")

    # Initialize the input
    relax_inp = abilab.AbinitInput(structure, pseudos=pseudos)

    # Set variables
    relax_inp.set_vars(
        ecut=20,
        paral_kgb=1,
        iomode=3,
        # Relaxation part
        ionmov=2,
        optcell=1,
        strfact=100,
        ecutsm=0.5,       # Important!
        dilatmx=1.15,     # Important!
        toldff=1e-6,
        tolmxf=1e-5,
        ntime=100,
    )

    # K-points sampling
    shiftk = [
        [0.5, 0.5, 0.5],
        [0.5, 0.0, 0.0],
        [0.0, 0.5, 0.0],
        [0.0, 0.0, 0.5]
    ]
    relax_inp.set_kmesh(ngkpt=[4, 4, 4], shiftk=shiftk)

    # Initialize the flow
    flow = flowtk.Flow(options.workdir, manager=options.manager)

    # Register the task.
    flow.register_relax_task(relax_inp)

    return flow


# This block generates the thumbnails in the AbiPy gallery.
# You can safely REMOVE this part if you are using this script for production runs.
if os.getenv("READTHEDOCS", False):
    __name__ = None
    import tempfile
    options = flowtk.build_flow_main_parser().parse_args(["-w", tempfile.mkdtemp()])
    build_flow(options).graphviz_imshow()


@flowtk.flow_main
def main(options):
    """
    This is our main function that will be invoked by the script.
    flow_main is a decorator implementing the command line interface.
    Command line args are stored in `options`.
    """
    return build_flow(options)


if __name__ == "__main__":
    sys.exit(main())

Run the script with:
run_sic_relax.py -s
then use:
abirun.py flow_sic_relax structures
to compare the input and output structures of the tasks:
Lattice parameters:
          formula  natom  angle0  angle1  angle2      a      b      c  volume  \
w0_t0_in   Si1 C1      2    60.0    60.0    60.0  3.065  3.065  3.065  20.351
w0_t0_out  Si1 C1      2    60.0    60.0    60.0  3.065  3.065  3.065  20.355

          abispg_num  P [GPa]  Max|F| eV/ang task_class              status
w0_t0_in        None      NaN            NaN  RelaxTask  Completed
w0_t0_out       None   -0.001            0.0  RelaxTask  Completed

Use `--verbose` to print atoms.
As you can see, the pressure at the end of the RelaxTask is very small (forces are zero by symmetry):
To visualize the evolution of the lattice parameters during the structura relaxation use:
abiopen.py flow_sic_relax/w0/t0/outdata/out_HIST.nc
and then inside the ipython terminal, type:
In [1]: %matplotlib
In [2]: abifile.plot()

Total running time of the script: (0 minutes 0.198 seconds)