Note
Go to the end to download the full example code.
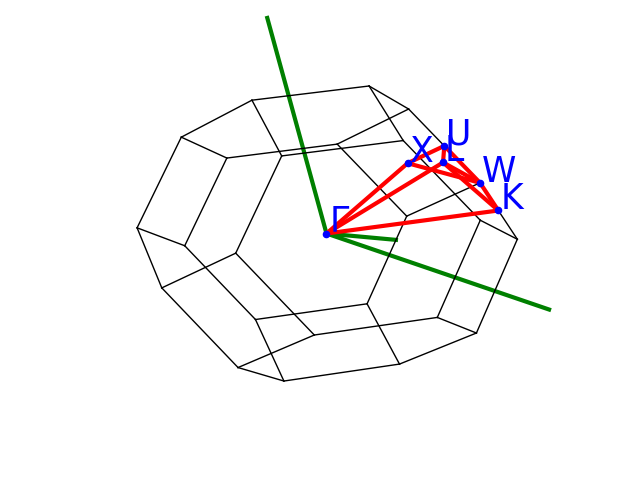
Brillouin zone
This example shows how to display the Brillouin zone with matplotlib or plotly.
Open the WKF file and extract the crystalline structure.
import abipy.data as abidata
from abipy.abilab import abiopen

wfk_file = abiopen(abidata.ref_file("si_scf_WFK.nc"))
structure = wfk_file.structure
To visualize the BZ with matplotlib, use:
structure.plot_bz()
For the plotly version, use:
structure.plotly_bz()
Remember to close the wfk file with:
wfk_file.close()
Total running time of the script: (0 minutes 0.189 seconds)