Note
Go to the end to download the full example code.
Thermodynamic properties
This example shows how to compute and plot thermodynamic properties within the harmonic approximation using the phonon DOS produced by anaddb.
import abipy.data as abidata
from abipy.abilab import abiopen
Read the Phonon DOS from the netcd file produced by anaddb (prtdos 2)
ncfile = abiopen(abidata.ref_file("trf2_5.out_PHDOS.nc"))
phdos = ncfile.phdos
Print crystalline structure and zero-point energy.
Full Formula (Al1 As1)
Reduced Formula: AlAs
abc   :   3.970101   3.970101   3.970101
angles:  60.000000  60.000000  60.000000
pbc   :       True       True       True
Sites (2)
  #  SP       a     b     c
---  ----  ----  ----  ----
  0  Al    0     0     0
  1  As    0.25  0.25  0.25

Abinit Spacegroup: spgid: 0, num_spatial_symmetries: 24, has_timerev: True, symmorphic: False
Zero point energy: 0.08400926480898568 eV 1.3459768111647533e-20 J 0.0030872835382061707 Ha
Compute free energy from 2 to 300 K (20 points) By default, energies are is eV and thermodynamic quantities are given on a per-unit-cell basis.
f = phdos.get_free_energy(tstart=2, tstop=300, num=20)
# f.plot()
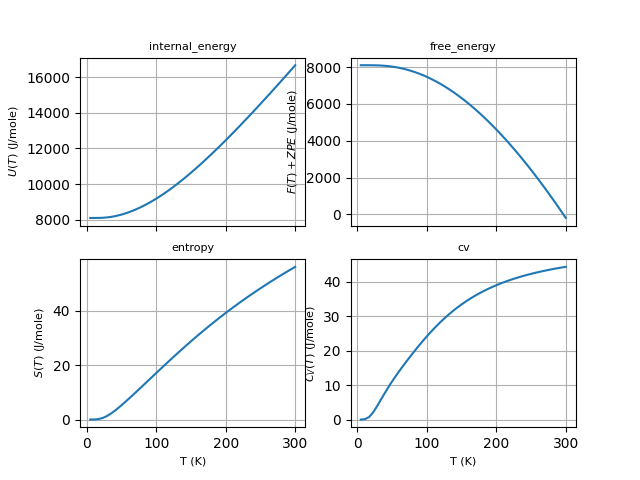
Plot U, F, S, Cv as a function of T. Use J/mol units, results are divided by formula_units.
phdos.plot_harmonic_thermo(units="Jmol", formula_units=1)
Plotly version with dark template.
phdos.plotly_harmonic_thermo(
    units="Jmol",
    formula_units=1,
    title=f"Thermodinamic properties of {ncfile.structure.formula}",
    template="plotly_dark",
)
Remember to close the file:
Total running time of the script: (0 minutes 0.195 seconds)