Note
Go to the end to download the full example code.
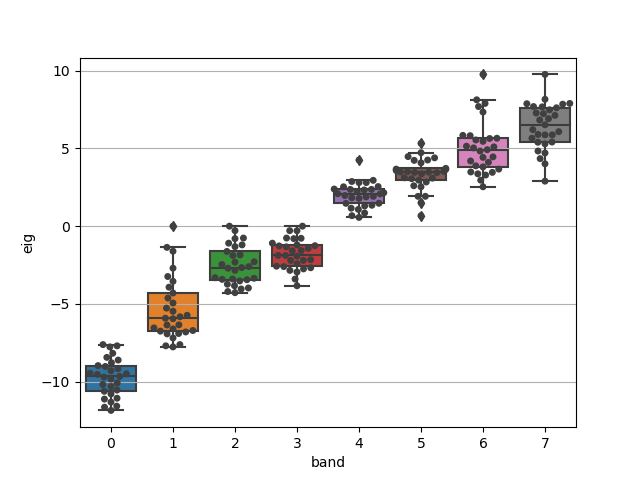
Electron bands box plot
This example shows how to use seaborn or plotly to draw a box plot showing the distributions of eigenvalues with respect to the band index.
Use swarm=True to show the datapoints on top of the boxes
ebands.boxplot(swarm=True)
For the plotly version, use:
ebands.boxplotly()
Total running time of the script: (0 minutes 0.280 seconds)