Note
Go to the end to download the full example code.
Infrared spectrum of AlAs
This example shows how to plot the infrared spectrum of a polar semiconductor (AlAs) from the DDB file See tutorial/lesson_rf2.html
For a command line interfase, use:
abiview.py ddb_ir in_DDB
Creating temporary file: /tmp/tmpq84d9tswmp-7000_DDB
ANADDB INPUT:
 # ANADDB input for phonon frequencies for a list of q-points generated by AbiPy.
 outdata_prefix "outdata/out"
 ifcflag 0
 asr 2
 chneut 1
 dipdip 1
 dipquad 1
 quadquad 1
 nph1l 1
 qph1l
 0 0 0
 1
 dieflag 1
workdir: /tmp/tmpj17wgt85
================================= Structure =================================
Full Formula (Si3 O6)
Reduced Formula: SiO2
abc   :   4.949906   4.949906   5.440897
angles:  90.000000  90.000000 120.000000
pbc   :       True       True       True
Sites (9)
  #  SP           a         b         c
---  ----  --------  --------  --------
  0  Si    0.528855  0         0.833333
  1  Si    0.471145  0.471145  0.5
  2  Si    0         0.528855  0.166667
  3  O     0.413167  0.147706  0.620242
  4  O     0.852294  0.265462  0.953576
  5  O     0.734538  0.586833  0.286909
  6  O     0.265462  0.852294  0.046424
  7  O     0.147706  0.413167  0.379758
  8  O     0.586833  0.734538  0.713091

Abinit Spacegroup: spgid: 1, num_spatial_symmetries: 6, has_timerev: True, symmorphic: True

============================ Oscillator strength ============================
Real part in Cartesian coordinates. a.u. units; 1 a.u. = 253.2638413 m3/s2. Set to zero below 1.00e-06.
                          xx                      yy                      zz   yz   xz   xy
mode
0                        0.0                     0.0                     0.0  0.0  0.0  0.0
1                        0.0                     0.0                     0.0  0.0  0.0  0.0
2                        0.0                     0.0                     0.0  0.0  0.0  0.0
3                        0.0                     0.0                     0.0  0.0  0.0  0.0
4                        0.0                     0.0                     0.0  0.0  0.0  0.0
5                        0.0                     0.0                     0.0  0.0  0.0  0.0
6      4.424721071887146e-06                     0.0                     0.0  0.0  0.0  0.0
7                        0.0   4.424721072105982e-06                     0.0  0.0  0.0  0.0
8                        0.0                     0.0                     0.0  0.0  0.0  0.0
9                        0.0                     0.0  0.00011308265177993422  0.0  0.0  0.0
10     6.992796119441694e-05                     0.0                     0.0  0.0  0.0  0.0
11                       0.0   6.992796120317463e-05                     0.0  0.0  0.0  0.0
12                       0.0  0.00019407121095825887                     0.0  0.0  0.0  0.0
13    0.00019407121096247612                     0.0                     0.0  0.0  0.0  0.0
14                       0.0                     0.0                     0.0  0.0  0.0  0.0
15                       0.0                     0.0  0.00020880483319441807  0.0  0.0  0.0
16                       0.0  1.3565145055186532e-05                     0.0  0.0  0.0  0.0
17    1.3565145054978093e-05                     0.0                     0.0  0.0  0.0  0.0
18                       0.0                     0.0   7.533020286384737e-05  0.0  0.0  0.0
19                       0.0   8.105029357467728e-05                     0.0  0.0  0.0  0.0
20     8.105029357316918e-05                     0.0                     0.0  0.0  0.0  0.0
21                       0.0   0.0009908321002341537                     0.0  0.0  0.0  0.0
22     0.0009908321002363605                     0.0                     0.0  0.0  0.0  0.0
23                       0.0                     0.0   0.0010434373746012597  0.0  0.0  0.0
24                       0.0                     0.0                     0.0  0.0  0.0  0.0
25    1.2586418339120014e-05                     0.0                     0.0  0.0  0.0  0.0
26                       0.0  1.2586418336794284e-05                     0.0  0.0  0.0  0.0

============================= Dielectric Tensors =============================
Electronic dielectric tensor (eps_inf) in Cartesian coordinates. Set to zero below 1.00e-03.
         x        y         z
x  2.45581  0.00000  0.000000
y  0.00000  2.45581  0.000000
z  0.00000  0.00000  2.486826

Zero-frequency dielectric tensor (eps_zero) in Cartesian coordinates. Set to zero below 1.00e-03.
          x         y         z
x  4.564213  0.000000  0.000000
y  0.000000  4.564213  0.000000
z  0.000000  0.000000  4.783768
import os
import abipy.data as abidata
from abipy import abilab
# Open DDB file for alpha-SiO2 taken from https://materialsproject.org/materials/mp-7000/
filepath = os.path.join(abidata.dirpath, "refs", "mp-7000_DDB.bz2")
ddb = abilab.abiopen(filepath)
# Invoke anaddb to compute dielectric tensor and oscillator strength.
tgen = ddb.anaget_dielectric_tensor_generator(asr=2, chneut=1, dipdip=1, verbose=1)
print(tgen)
# Set phonon damping factor in eV (full width).
gamma_ev = 1e-3
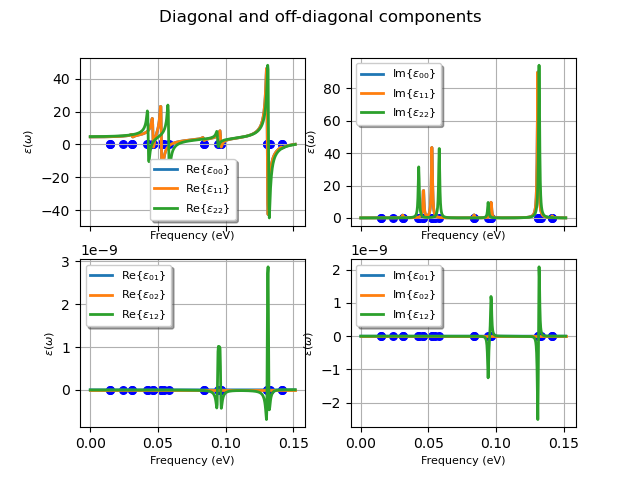
# Plot IR spectrum in Cartesian coordinates.
tgen.plot_all(gamma_ev=gamma_ev, title="Diagonal and off-diagonal components")
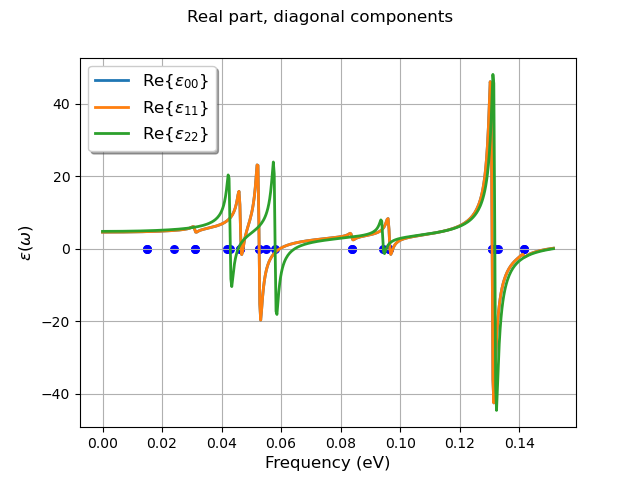
tgen.plot(component="diag", reim="re", gamma_ev=gamma_ev, title="Real part, diagonal components")
tgen.plotly(component="diag", reim="re", gamma_ev=gamma_ev, title="Real part, diagonal components")
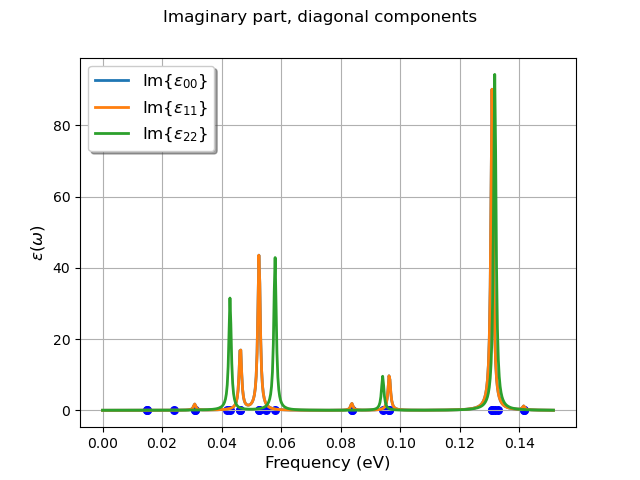
tgen.plot(component="diag", reim="im", gamma_ev=gamma_ev, title="Imaginary part, diagonal components")
tgen.plotly(component="diag", reim="im", gamma_ev=gamma_ev, title="Imaginary part, diagonal components")
ddb.close()
Total running time of the script: (0 minutes 1.625 seconds)