Note
Go to the end to download the full example code.
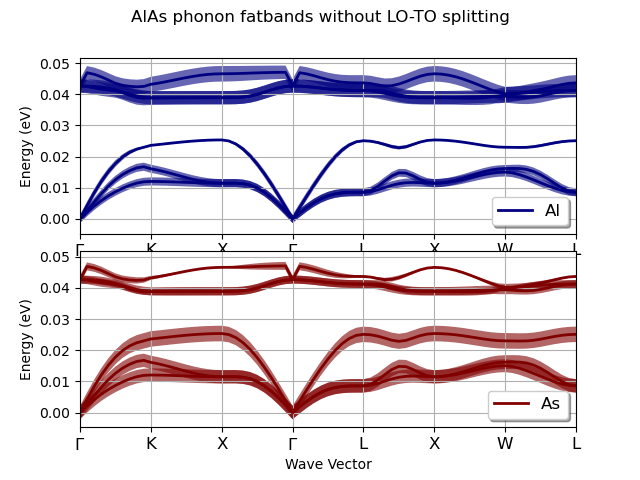
Phonon fatbands
This example shows how to plot the phonon fatbands of AlAs. See tutorial/lesson_rf2.html
![phonon displacements at $\Gamma$, qpoint = $\Gamma$ [+0.000, +0.000, +0.000]](../_images/sphx_glr_plot_phonon_fatbands_003.png)
![phonon eigenvectors at $\Gamma$, qpoint = $\Gamma$ [+0.000, +0.000, +0.000]](../_images/sphx_glr_plot_phonon_fatbands_004.png)
![qpoint = $\Gamma$ [+0.000, +0.000, +0.000], qpoint = $\Gamma$ [+0.000, +0.000, +0.000], qpoint = $\Gamma$ [+0.000, +0.000, +0.000]](../_images/sphx_glr_plot_phonon_fatbands_005.png)
Warning: file /home/runner/work/abipy/abipy/abipy/data/refs/alas_phonons/trf2_5.out_PHBST.nc does not contain atomic_numbers.
Particular methods need them!
import abipy.data as abidata
from abipy.abilab import abiopen
# Open the PHBST file produced by anaddb and get the phonon bands.
with abiopen(abidata.ref_file("trf2_5.out_PHBST.nc")) as ncfile:
phbands = ncfile.phbands
# Plot the phonon band structure with matplotlib.
phbands.plot_fatbands(title="AlAs phonon fatbands without LO-TO splitting")
# For the plotly version, use:
phbands.plotly_fatbands(title="AlAs phonon fatbands without LO-TO splitting")
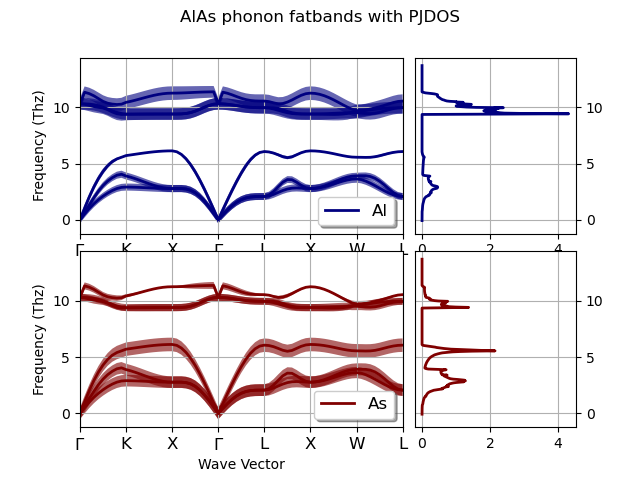
# Provide the PHDOS file path produced by anaddb.
# sphinx_gallery_thumbnail_number = 2
phdos_path = abidata.ref_file("trf2_5.out_PHDOS.nc")
# Plot the phonon band structure + PJDOS with matplotlib.
phbands.plot_fatbands(units="Thz", phdos_file=phdos_path, title="AlAs phonon fatbands with PJDOS")
# For the plotly version, use:
phbands.plotly_fatbands(units="Thz", phdos_file=phdos_path, title="AlAs phonon fatbands with PJDOS")
# Plot contributions to the phonon displacement at the Gamma point grouped by atom type.
phbands.plot_phdispl(qpoint=(0, 0, 0), units="meV", title=r"phonon displacements at $\Gamma$")
# Plot (orthonormal) eigenvectors instead of displacements.
phbands.plot_phdispl(qpoint=(0, 0, 0), use_eigvec=True, units="meV", title=r"phonon eigenvectors at $\Gamma$")
# Decompose contributions along the three Cartesian directions.
phbands.plot_phdispl_cartdirs(qpoint=(0, 0, 0), units="cm-1")
Total running time of the script: (0 minutes 0.956 seconds)