Note
Go to the end to download the full example code.
Quasi-harmonic approximation
This example shows how to use the GSR.nc and PHDOS.nc files computed with different volumes to compute thermodynamic properties within the quasi-harmonic approximation.
WARNING combiplot: Bands have different number of k-points:
[83, 81]
import os
import abipy.data as abidata

from abipy.dfpt.phonons import PhononBands
from abipy.dfpt.qha import QHA

# We use a list of GSR.nc and PHDOS.nc files corresponding to different isotropic strains.
# These files are shipped with AbiPy so that we don't need to run calculations from scratch.
strains = [-4, -2, 0, 2, 4, 6]
dirpath = os.path.join(abidata.dirpath, "refs", "si_qha")

gsr_paths = [os.path.join(dirpath, "mp-149_{:+d}_GSR.nc".format(s)) for s in strains]
dos_paths = [os.path.join(dirpath, "mp-149_{:+d}_PHDOS.nc".format(s)) for s in strains]

# Initialize QHA object from files.
# The PHDOS.nc files can be obtained from the DDB used ddb.anaget_phbst_and_phdos_files(...)
qha = QHA.from_files(gsr_paths, dos_paths)

# To change the default EOS (vinet), use
#qha.set_eos("murnaghan")

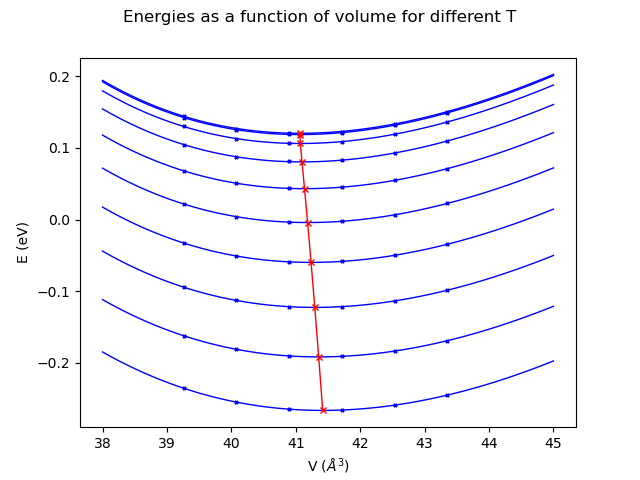
qha.plot_energies(title="Energies as a function of volume for different T")

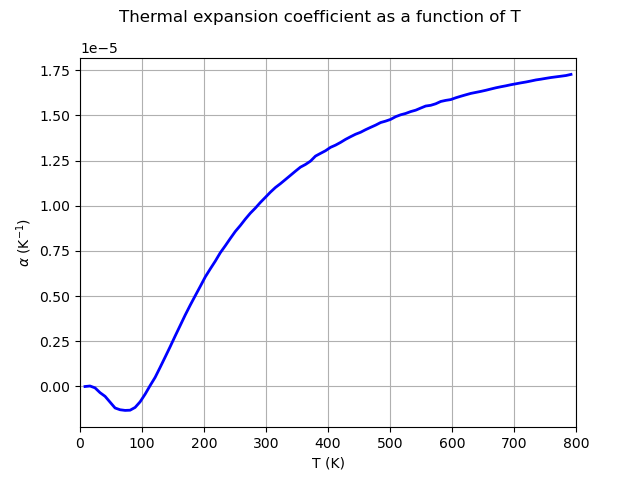
qha.plot_thermal_expansion_coeff(title="Thermal expansion coefficient as a function of T")

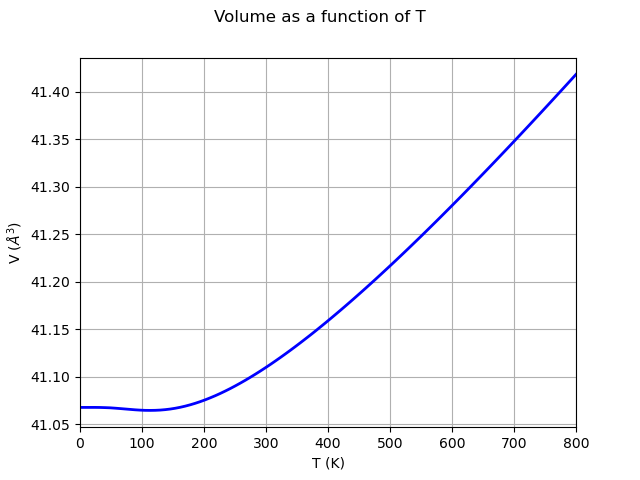
qha.plot_vol_vs_t(title="Volume as a function of T")

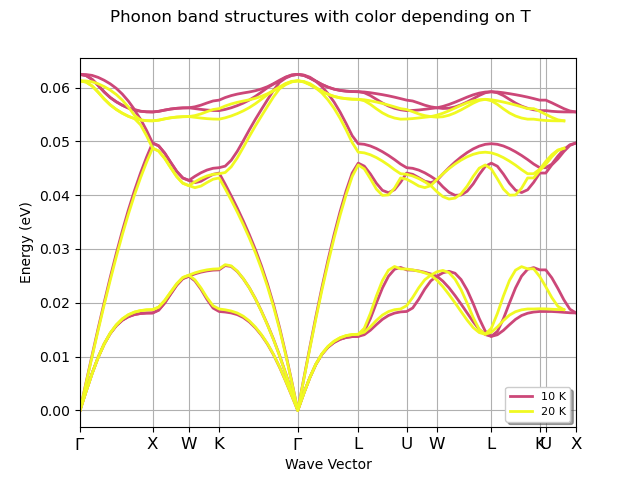
# Fake temperatures to test the plotting function.
phbs_list = [PhononBands.from_file(os.path.join(dirpath, "mp-149_{:+d}_PHBST.nc".format(s))) for s in
             strains[2:4]]

qha.plot_phbs(phbs_list, temperatures=[10, 20], title="Phonon band structures with color depending on T")

# Here we build a Phonopy QHA object.
# Cannot run this code because it breaks sphinx-gallery

#qha_phonopy = qha.get_phonopy_qha(tstop=500, num=11)
#qha_phonopy.run()
#qha_phonopy.plot_bulk_modulus_temperature().show()
Total running time of the script: (0 minutes 1.399 seconds)


