Note
Go to the end to download the full example code.
Quasi-harmonic approximation with v-ZSISA
This example shows how to use the GSR.nc and PHDOS.nc files computed with different volumes to compute thermodynamic properties within the v-ZSISA approximation.
import os

import abipy.data as abidata
from abipy.dfpt.vzsisa import Vzsisa

# Root points to the directory in the git submodule with the output results.
root = os.path.join(abidata.dirpath, "data_v-ZSISA-QHA.git", "Si_v_ZSISA_approximation")

strains = [96, 98, 100, 102, 104, 106]
strains2 = [98, 100, 102, 104, 106]  # EinfVib4(D)
# strains2 = [96, 98, 100, 102, 104] # EinfVib4(S)
# strains2 = [100, 102, 104] # EinfVib2(D)

gsr_paths = [os.path.join(root, f"scale_{s:d}_GSR.nc") for s in strains]
ddb_paths = [os.path.join(root, f"scale_{s:d}_GSR_DDB") for s in strains]
phdos_paths = [os.path.join(root, f"scale_{s:d}_PHDOS.nc") for s in strains2]

qha = Vzsisa.from_ddb_phdos_files(ddb_paths, phdos_paths)
tstart, tstop, num = 0, 800, 101
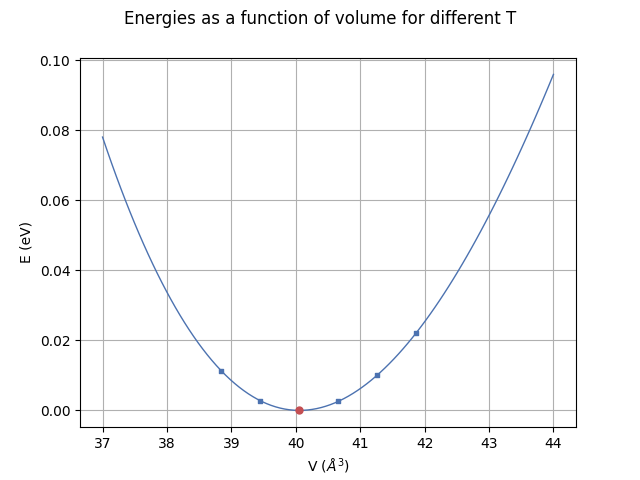
Plot BO Energies as a function of volume for different T
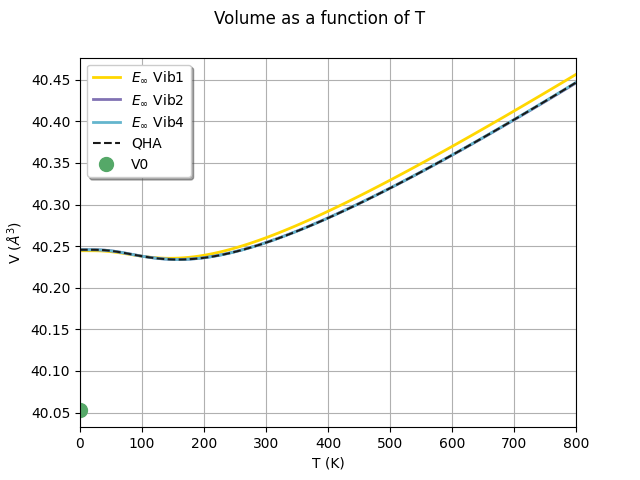
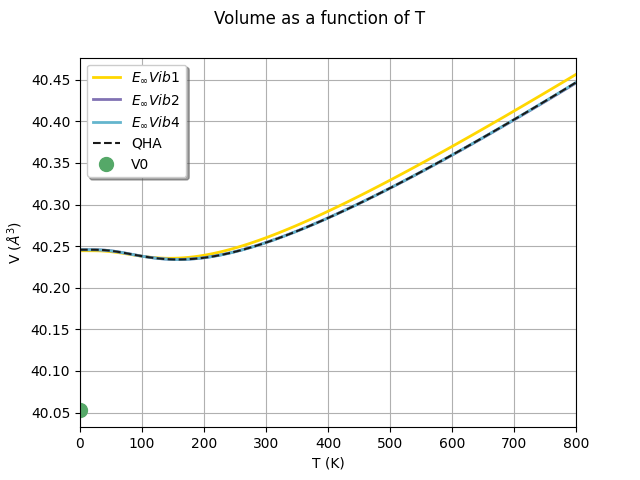
Plot Volume as a function of T
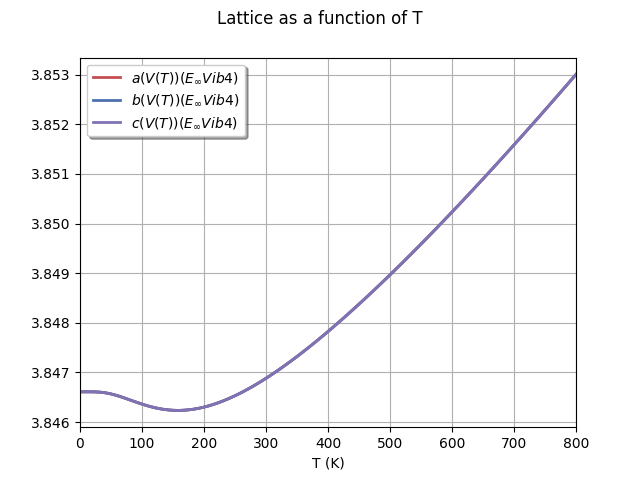
Plot Lattice as a function of T
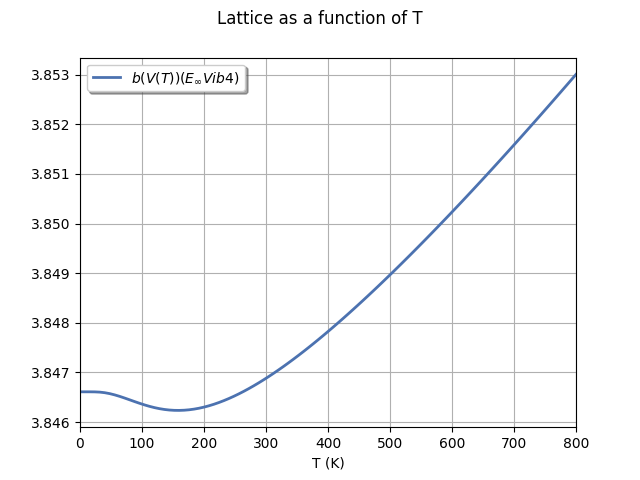
Plot Lattice as a function of T
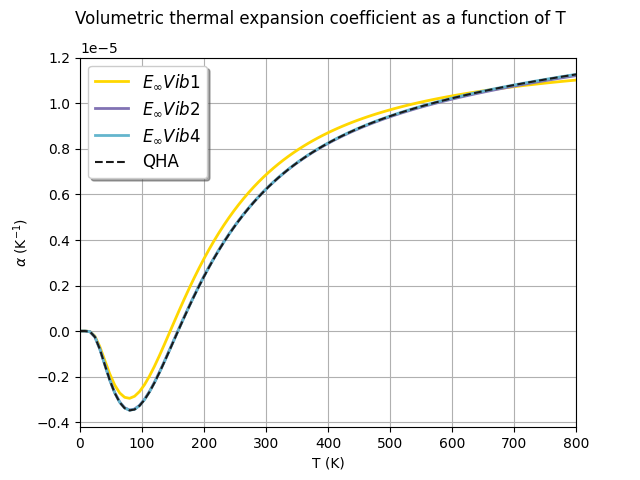
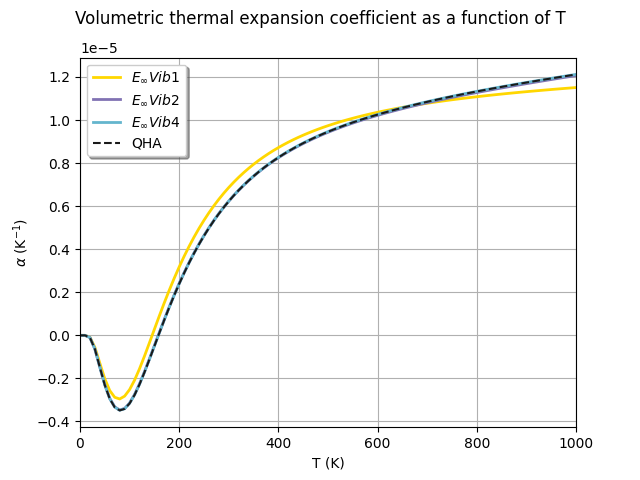
Plot Volumetric thermal expansion coefficient as a function of T
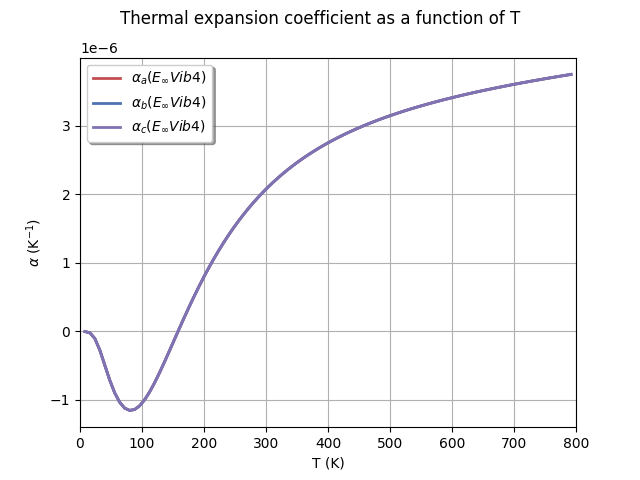
Plot Thermal expansion coefficient as a function of T

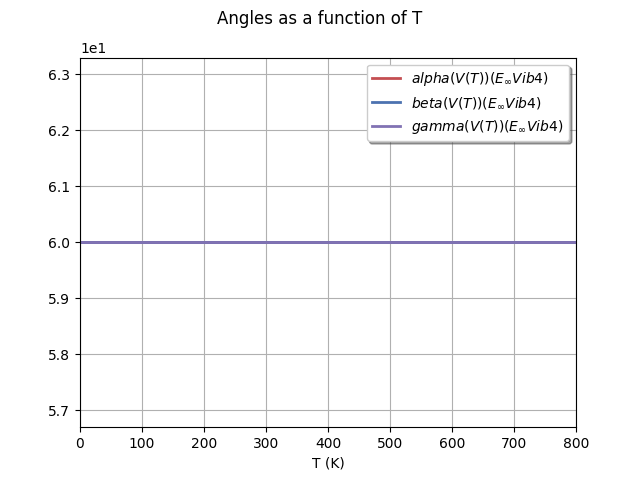
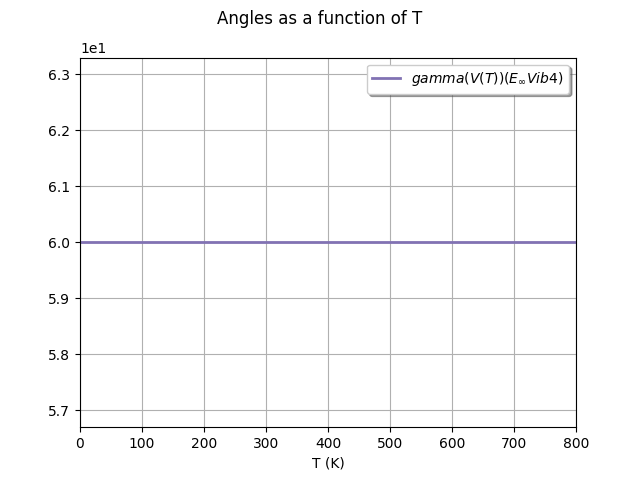
Plot Angles as a function of T
Plot Volume as a function of T. 4th order polinomial
Plot Lattice as a function of T. 4th order polinomial
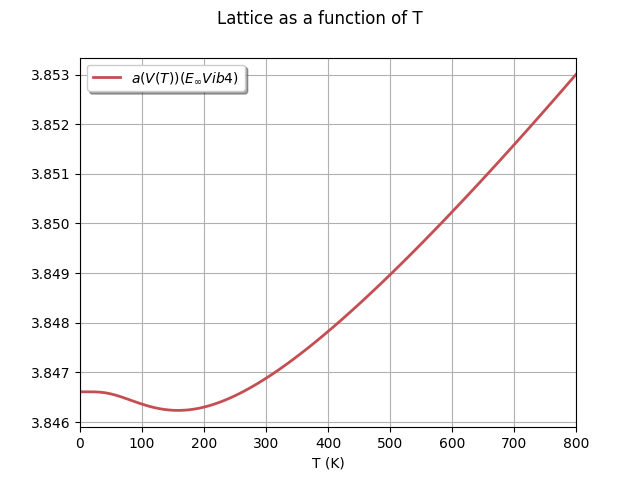
Plot Lattice as a function of T. 4th order polinomial

Plot Volumetric thermal expansion coefficient as a function of T
qha.plot_thermal_expansion_coeff_4th(tref=293)
Plot Thermal expansion coefficient as a function of T
Plot Angles as a function of T.
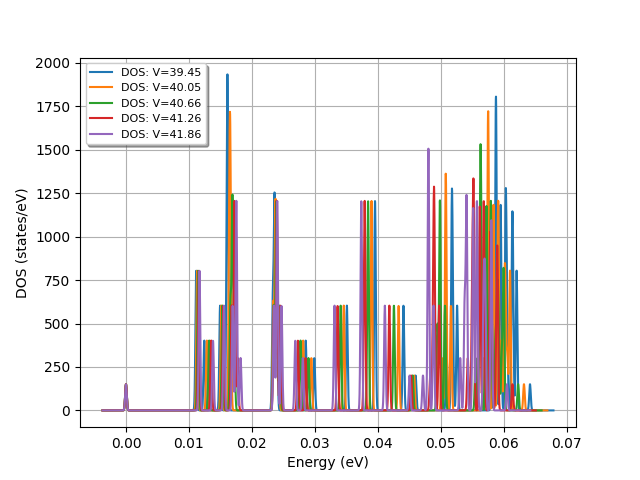
Create plotter to plot all the phonon DOS.
Total running time of the script: (0 minutes 6.354 seconds)