Note
Go to the end to download the full example code.
Phonon band structures with LO-TO
This example shows how to plot the phonon band structure of AlAs. without the LO-TO splitting. See also tutorial/lesson_rf2.html
Open the PHBST file produced by anaddb and get the phonon bands. Note that the treatment of the LO-TO splitting for q–> 0 requires additional steps. See plot_phonons_lo_to.py.
import abipy.data as abidata
from abipy.abilab import abiopen

with abiopen(abidata.ref_file("trf2_5.out_PHBST.nc")) as ncfile:
    phbands = ncfile.phbands
Warning: file /home/runner/work/abipy/abipy/abipy/data/refs/alas_phonons/trf2_5.out_PHBST.nc does not contain atomic_numbers.
Particular methods need them!
Read the Phonon DOS from the netcd file produced by anaddb (prtdos 2)
with abiopen(abidata.ref_file("trf2_5.out_PHDOS.nc")) as ncfile:
    phdos = ncfile.phdos
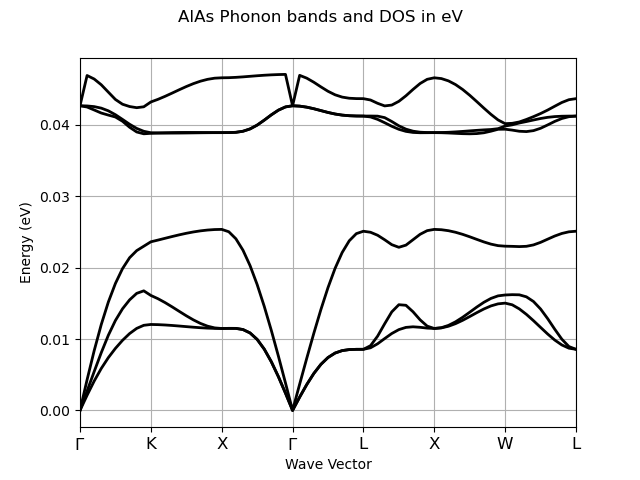
Plot phonon bands and DOS with matplotib:
phbands.plot(title="AlAs Phonon bands and DOS in eV")
For the plotly version use:
phbands.plotly(title="AlAs Phonon bands and DOS in eV")
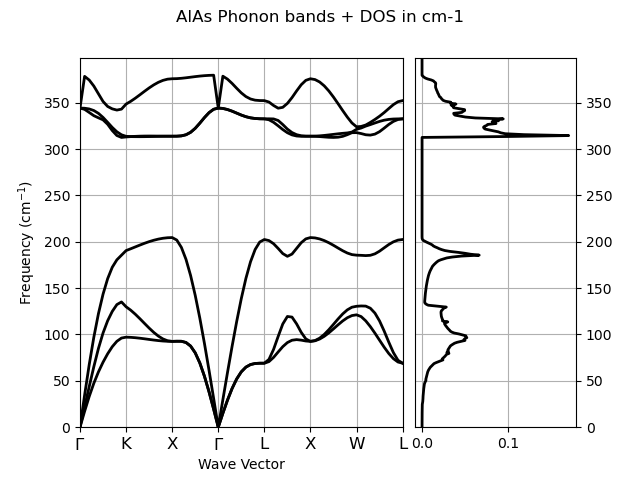
To plot phonon bands and phonon DOS with matplotlib use:
phbands.plot_with_phdos(phdos, units="cm-1", title="AlAs Phonon bands + DOS in cm-1")
For the plotly version use:
phbands.plotly_with_phdos(phdos, units="cm-1", title="AlAs Phonon bands + DOS in cm-1")
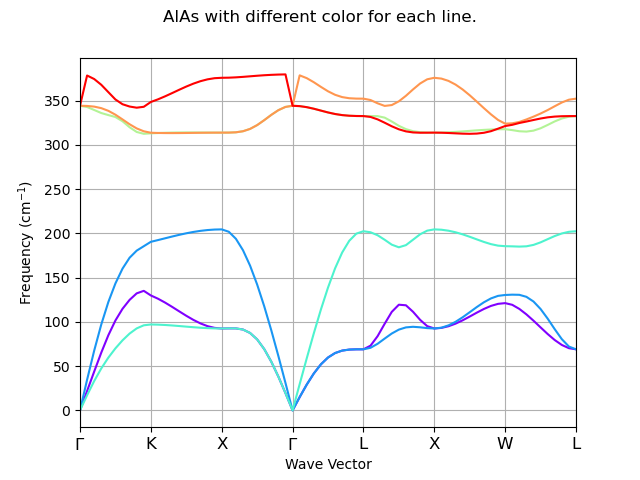
Plot the phonon band structure with different color for each line (matplotlib version).
phbands.plot_colored_matched(units="cm-1", title="AlAs with different color for each line.")
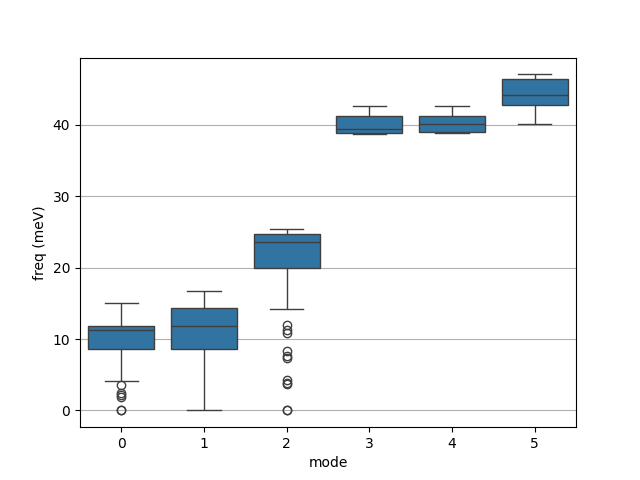
Use seaborn and matplotlib to draw a box plot showing the distribution of the phonon frequencies with respect to the mode index.
phbands.boxplot(units="meV")
For the plotly version use:
phbands.boxplotly(units="meV")
Total running time of the script: (0 minutes 0.619 seconds)