Note
Go to the end to download the full example code.
QHA_2D method
This example shows how to use the GSR.nc and PHDOS.nc files computed with different volumes to compute thermodynamic properties within the quasi-harmonic approximation.
import os

import numpy as np

import abipy.data as abidata
from abipy.dfpt.qha_2D import QHA_2D

bo_strains_a = [995, 1000, 1005, 1010, 1015]
bo_strains_c = [995, 1000, 1005, 1010, 1015]
phdos_strains_a = [1000, 1005, 1010]
phdos_strains_c = [1000, 1005, 1010]

# Root points to the directory in the git submodule with the output results.
root = os.path.join(abidata.dirpath, "data_v-ZSISA-QHA.git", "ZnO_ZSISA_approximation")

# gsr_paths = [[f"scale_{s1}_{s3}/out_GSR.nc" for s3 in bo_strains_c] for s1 in bo_strains_a]
gsr_paths = [[os.path.join(root, f"scale_{s1}_{s3}/out_GSR_DDB") for s3 in bo_strains_c] for s1 in bo_strains_a]
phdos_paths = [
    [os.path.join(root, f"scale_{s1}_{s3}/out_PHDOS.nc") for s3 in phdos_strains_c] for s1 in phdos_strains_a
]

bo_strains_a = (np.array(bo_strains_a) - 1000) / 100
bo_strains_c = (np.array(bo_strains_c) - 1000) / 100
bo_strains_ac = [bo_strains_a, bo_strains_c]

phdos_strains_a = (np.array(phdos_strains_a) - 1000) / 100
phdos_strains_c = (np.array(phdos_strains_c) - 1000) / 100
phdos_strains_ac = [phdos_strains_a, phdos_strains_c]

qha = QHA_2D.from_files(gsr_paths, phdos_paths, bo_strains_ac, phdos_strains_ac, gsr_file="DDB")

tstart, tstop, num = 0, 1000, 101
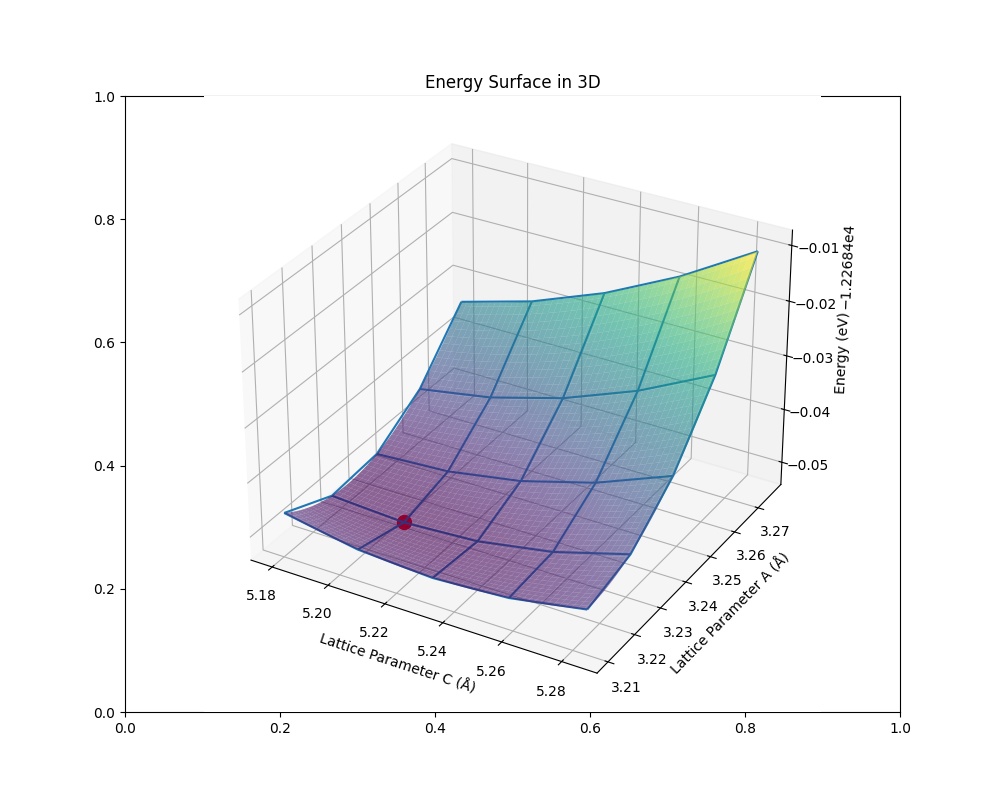
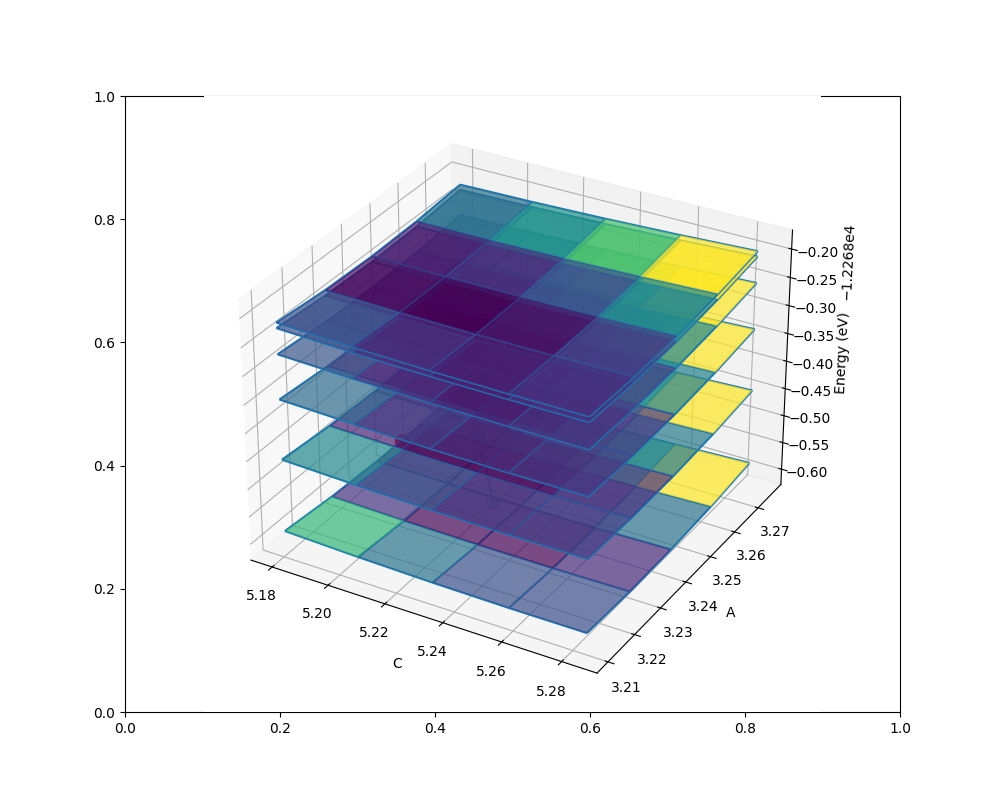
qha.plot_free_energies(tstart=tstart, tstop=500, num=6)
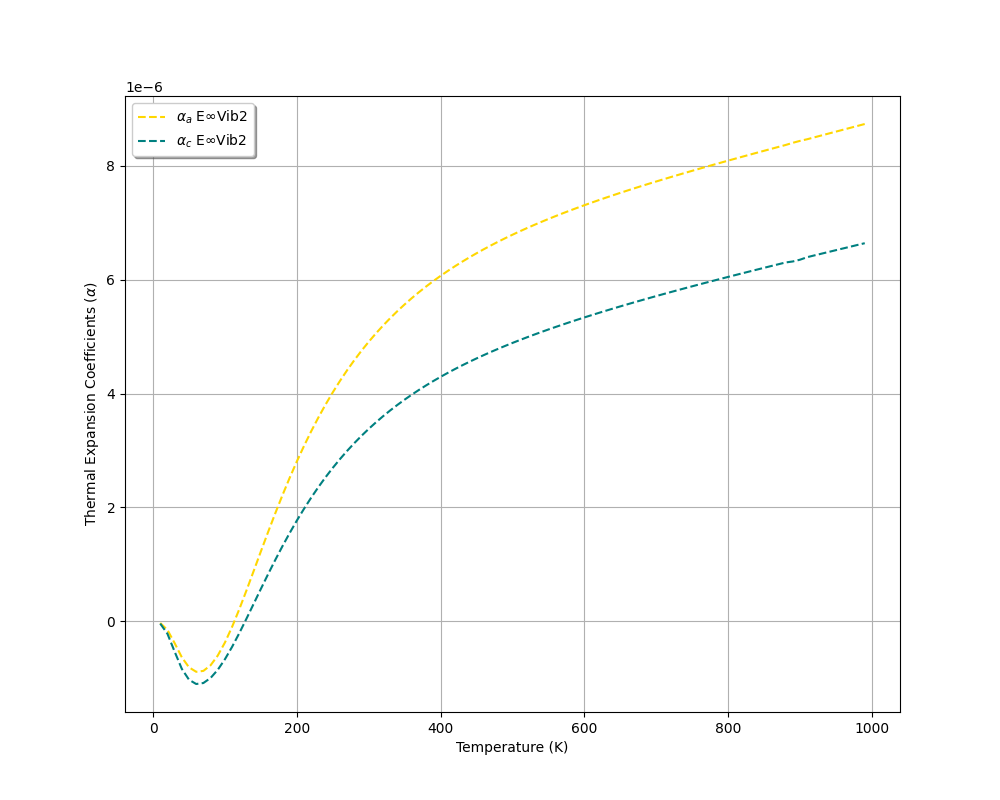
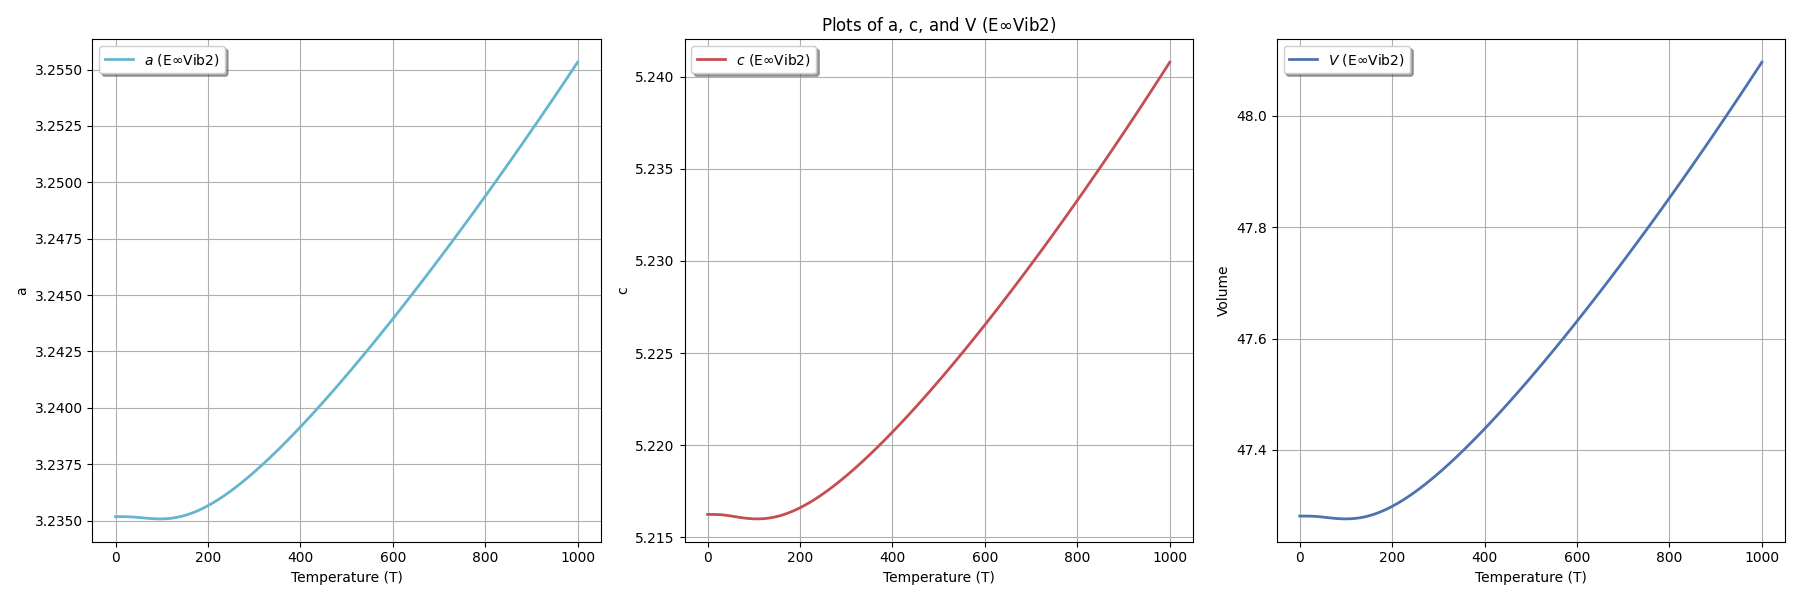
Writing thermal expansion data to: thermal-expansion_data.txt
Total running time of the script: (0 minutes 2.657 seconds)