Note
Go to the end to download the full example code.
Unfolding with fold2bloch
This example shows how to plot the results produced by fold2bloch. See <http://www.abinit.org/doc/helpfiles/for-v8.0/tutorial/lesson_fold2Bloch.html>
================================= File Info =================================
Name: h6_FOLD2BLOCH.nc
Directory: /home/runner/work/abipy/abipy/abipy/data/refs
Size: 35.26 kB
Access Time: Mon Jul 27 12:55:33 2026
Modification Time: Mon Jul 27 12:47:07 2026
Change Time: Mon Jul 27 12:47:07 2026

================================= Structure =================================
Full Formula (H6)
Reduced Formula: H2
abc   :   1.587532   3.175063   4.762595
angles:  90.000000  90.000000  90.000000
pbc   :       True       True       True
Sites (6)
  #  SP      a    b         c
---  ----  ---  ---  --------
  0  H       0  0    0
  1  H       0  0    0.333333
  2  H       0  0    0.666667
  3  H       0  0.5  0
  4  H       0  0.5  0.333333
  5  H       0  0.5  0.666667

Abinit Spacegroup: spgid: 0, num_spatial_symmetries: 48, has_timerev: True, symmorphic: True

============================== Electronic Bands ==============================
Number of electrons: 6.0, Fermi level: -1.060 (eV)
nsppol: 1, nkpt: 42, mband: 4, nspinor: 1, nspden: 1
smearing scheme: none (occopt 1), tsmear_eV: 0.272, tsmear Kelvin: 3157.7
WARNING: Cannot compute direct and fundamental gap.
Bandwidth: 11.116 (eV)
Valence maximum located at kpt index 41:
    spin: 0, kpt: [+0.000, +0.000, +0.500], band: 2, eig: -1.060, occ: 2.000
TIP: Use `--verbose` to print k-point coordinates with more digits
Direct lattice of the primitive cell:
abc   :   1.587532   1.587532   1.587532
angles:  90.000000  90.000000  90.000000
Diagonal folding: [1 2 3]
import abipy.data as abidata
from abipy import abilab
with abilab.abiopen(abidata.ref_file("h6_FOLD2BLOCH.nc")) as ncfile:
print(ncfile)
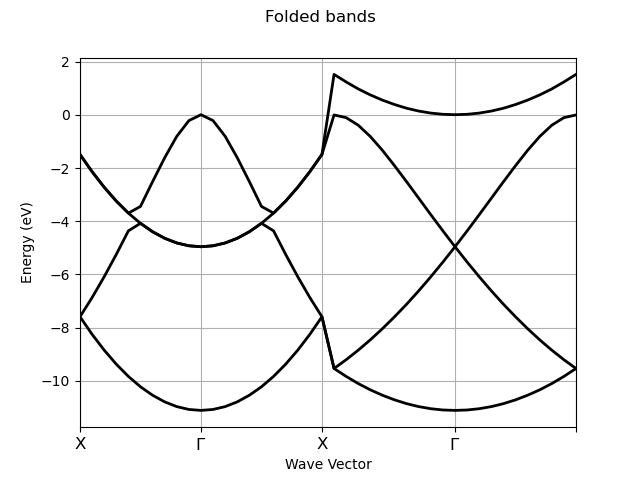
# Plot folded bands
ncfile.ebands.plot(title="Folded bands")
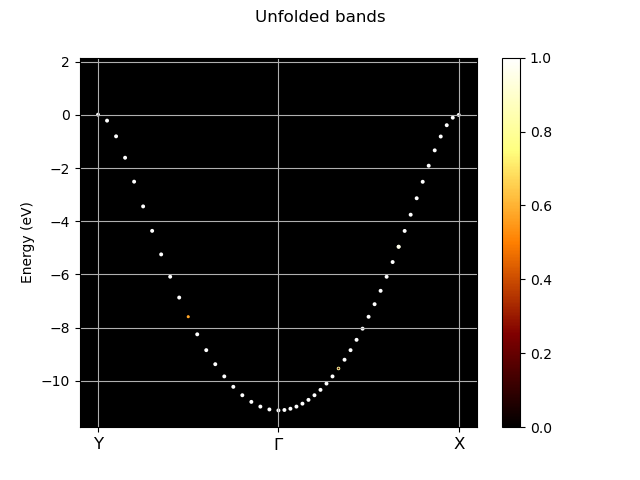
# Plot unfolded bands along the path defined by kbounds.
kbounds = [0, 1 / 2, 0, 0, 0, 0, 0, 0, 1 / 2]
klabels = ["Y", r"$\Gamma$", "X"]
# sphinx_gallery_thumbnail_number = 2
ncfile.plot_unfolded(kbounds, klabels, title="Unfolded bands")
Total running time of the script: (0 minutes 0.247 seconds)