Note
Go to the end to download the full example code.
Band structure plot
This example shows how to plot a band structure using the eigenvalues stored in the GSR file produced at the end of the GS run.
import abipy.data as abidata
from abipy.abilab import abiopen
Here we use one of the GSR files shipped with abipy. Replace filename with the path to your GSR file or your WFK file.
filename = abidata.ref_file("si_nscf_GSR.nc")
Open the GSR file and extract the band structure. (alternatively one can use the shell and abiopen.py OUT_GSR.nc -nb to open the file in a jupyter notebook.
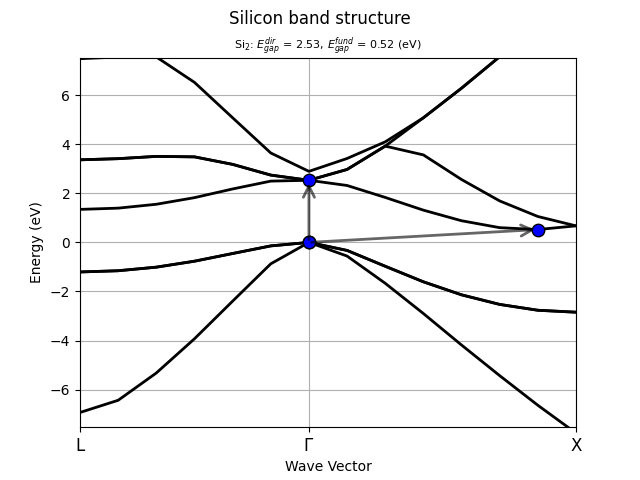
Plot the band energies with matplotlib. Note that the labels for the k-points are found automatically in an internal database. Use with_gaps to show fundamental and direct gaps.
ebands.plot(with_gaps=True, title="Silicon band structure")
For the plotly version, use:
ebands.plotly(with_gaps=True, title="Silicon band structure")

# .. warning:
#
# Note that, for the time being, ``with_gaps`` is incompatible with the ``title`` argument.
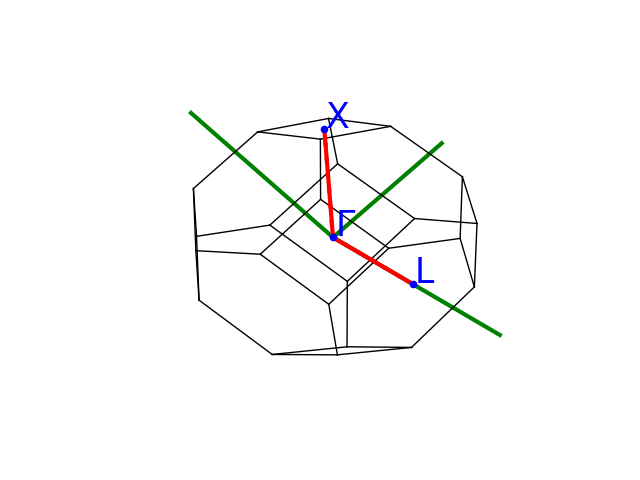
Plot the BZ and the k-point path with matplotlib
ebands.kpoints.plot()
Total running time of the script: (0 minutes 0.592 seconds)