Note
Go to the end to download the full example code.
Phonon bands with/without the ASR
This example shows how to plot a phonon band structure with and without enforcing the acoustic sum rule (ASR). Both matplotlib and plotly plots are supported.
Important
Note that a manager.yml configuration file and an abinit installation are required to run this script as AbiPy needs to invoke anaddb to compute phonons from the DDB file.
Open the DDB file with:
import abipy.data as abidata
from abipy import abilab

filepath = abidata.ref_file("mp-1009129-9x9x10q_ebecs_DDB")
ddb = abilab.abiopen(filepath)
The ddb.anacompare_asr method computes the phonon bands and the DOS by calling anaddb
with different values of asr and returns a PhononBandsPlotter object:
To make the computation faster, we use the advanced options dipdip -1.
This option should produce results similar to dipdip 1 yet make sure to test
the effect of this variable before using it in production.
plotter = ddb.anacompare_asr(asr_list=(0, 2), dipdip=-1)
print(plotter)
[0] asr: 0, dipdip: -1, chneut: 1 --> ================================= Structure =================================
Full Formula (Mg1 O1)
Reduced Formula: MgO
abc   :   2.908638   2.908638   2.656848
angles:  90.000000  90.000000 120.000000
pbc   :       True       True       True
Sites (2)
  #  SP           a         b    c
---  ----  --------  --------  ---
  0  Mg    0         0         0
  1  O     0.333333  0.666667  0.5

Abinit Spacegroup: spgid: 1, num_spatial_symmetries: 12, has_timerev: True, symmorphic: False

Number of q-points: 345
Atomic mass units: {np.float64(12.0): np.float64(24.305), np.float64(8.0): np.float64(15.9994)}
Has non-analytical contribution for q --> 0: True
[1] asr: 2, dipdip: -1, chneut: 1 --> ================================= Structure =================================
Full Formula (Mg1 O1)
Reduced Formula: MgO
abc   :   2.908638   2.908638   2.656848
angles:  90.000000  90.000000 120.000000
pbc   :       True       True       True
Sites (2)
  #  SP           a         b    c
---  ----  --------  --------  ---
  0  Mg    0         0         0
  1  O     0.333333  0.666667  0.5

Abinit Spacegroup: spgid: 1, num_spatial_symmetries: 12, has_timerev: True, symmorphic: False

Number of q-points: 345
Atomic mass units: {np.float64(12.0): np.float64(24.305), np.float64(8.0): np.float64(15.9994)}
Has non-analytical contribution for q --> 0: True
To plot the bands on the same figure with matplotlib, use:
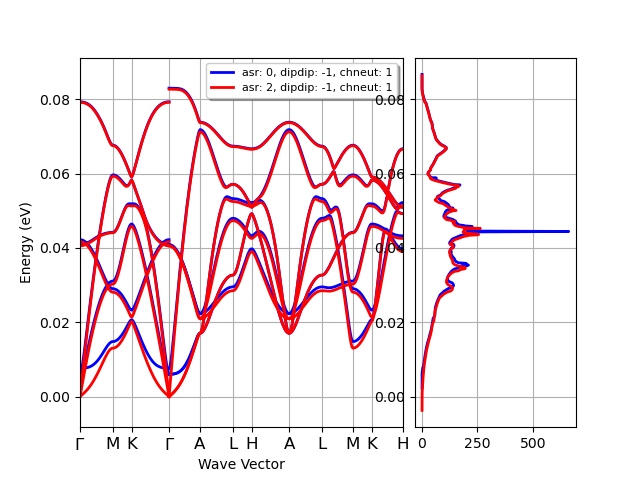
For the plotly version, use:
To disable the DOS computation, set ``nqsmall` to 0:
plotter = ddb.anacompare_asr(asr_list=(0, 2), nqsmall=0, ndivsm=10, dipdip=-1)
To plot the bands on different subplots with matplotlib, use:
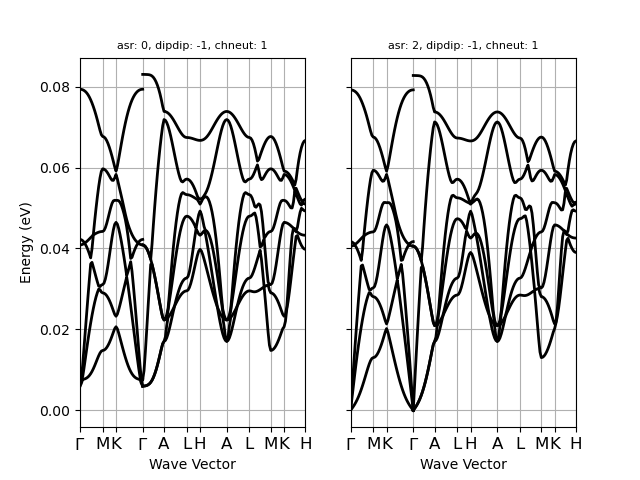
For the plotly version, use:
Finally, remember to close the file with:
ddb.close()
Total running time of the script: (0 minutes 9.889 seconds)