Note
Go to the end to download the full example code.
Spin-polarized e-bands
This example shows how to plot the band structure of nickel using the eigenvalues stored in the GSR file produced at the end of the GS run.
import abipy.data as abidata
from abipy import abilab
# Open the GSR file and extract the band structure.
# (alternatively one can use the shell and `abiopen.py OUT_GSR.nc -nb`
# to open the file in a jupyter notebook.
with abilab.abiopen(abidata.ref_file("ni_666k_GSR.nc")) as ncfile:
ni_ebands_kmesh = ncfile.ebands
with abilab.abiopen(abidata.ref_file("ni_kpath_GSR.nc")) as ncfile:
ni_ebands_kpath = ncfile.ebands
# Energy limits in eV for plots. The pseudo contains semi-core states but
# we are not interested in this energy region. Fermi level set to zero.
elims = [-10, 2]
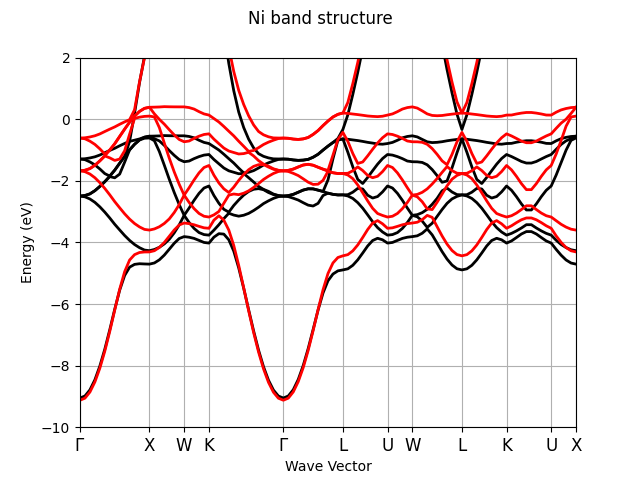
# Plot band energies on k-path
ni_ebands_kpath.plot(ylims=elims, title="Ni band structure")
Plot energies on k-path + DOS with plotly
Plot energies on k-path + DOS with matplotlib
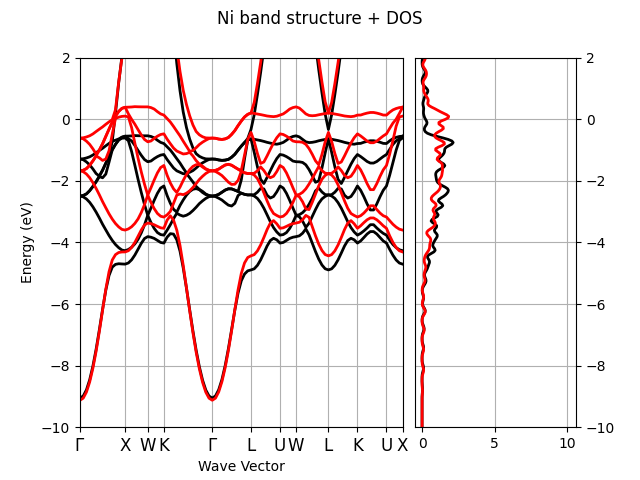
Plot energies on k-path + DOS with plotly
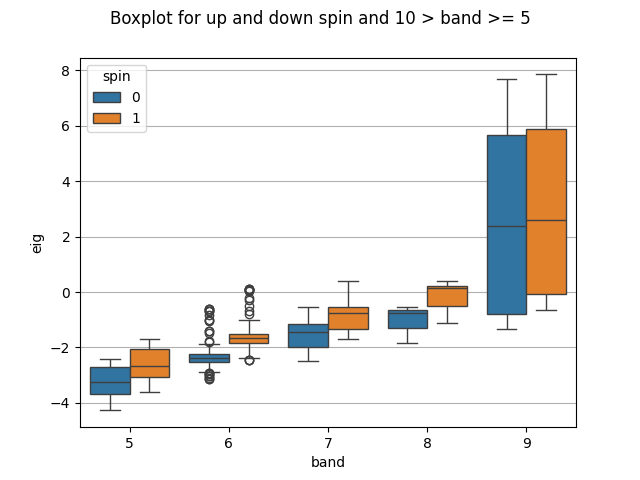
matplotlib box plot for 10 > band >= 5
ni_ebands_kpath.boxplot(brange=[5, 10], title="Boxplot for up and down spin and 10 > band >= 5")
For the plotly version, use:
ni_ebands_kpath.boxplotly(brange=[5, 10], title="Boxplot for up and down spin and 10 > band >= 5")
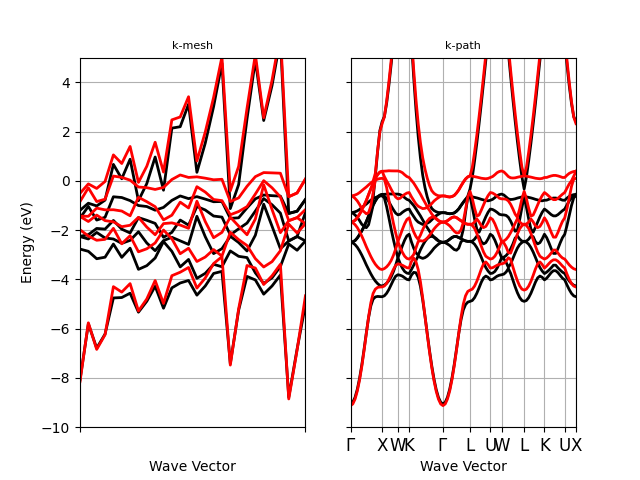
Now we use ElectronBandsPlotter to analyze multiple ElectronBands object
plotter = abilab.ElectronBandsPlotter()
plotter.add_ebands("k-mesh", ni_ebands_kmesh)
plotter.add_ebands("k-path", ni_ebands_kpath)
# Energy window in eV around the Fermi level.
ylims = [-10, 5]
# plotter.combiplot(ylims=ylims)
plotter.gridplot(ylims=ylims)
plotter.gridplotly(ylims=ylims)
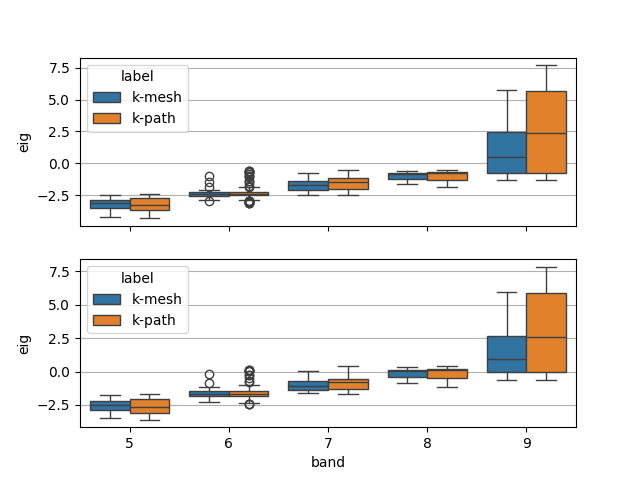
# plotter.boxplot(brange=[5, 10])
plotter.combiboxplot(brange=[5, 10])
Total running time of the script: (0 minutes 1.474 seconds)