Note
Go to the end to download the full example code.
Lobster COHP/COP/DOS
This example shows how to analyze the output files produced by Lobster code <<http://schmeling.ac.rwth-aachen.de/cohp/>
Use abiview.py lobster DIRPATH for a command line interface.
================================= COOP File =================================

COOP: Number of energies: 401, from -14.035 to 6.015 (eV) with E_fermi set 0 (was 2.298)
has_partial_projections: True, nsppol: 1
Number of pairs: 2
[0] Ga@0 --> As@1
[1] As@1 --> Ga@0

================================= COHP File =================================

COHP: Number of energies: 401, from -14.035 to 6.015 (eV) with E_fermi set 0 (was 2.298)
has_partial_projections: True, nsppol: 1
Number of pairs: 2
[0] Ga@0 --> As@1
[1] As@1 --> Ga@0

============================== ICHOHPLIST File ==============================
Number of pairs: 2
 index0  index1 type0 type1  spin  average distance n_bonds   pair
      0       1    Ga    As     0 -4.36062  2.49546    None (0, 1)
      1       0    As    Ga     0 -4.36062  2.49546    None (1, 0)

=============================== Lobster DOSCAR ===============================
Number of energies: 401, from -14.035 to 6.015 (eV) with E_fermi set to 0 (was 2.298)
nsppol: 1
Number of sites in projected DOS: 2
0 --> {4s, 4p_y, 4p_z, 4p_x}
1 --> {4s, 4p_y, 4p_z, 4p_x}
import os
import abipy.data as abidata

from abipy.abilab import LobsterAnalyzer

dirpath = os.path.join(abidata.dirpath, "refs", "lobster_gaas")

# Open the all the lobster files produced in directory dirpath
# with the (optional) prefix GaAs_
lobana = LobsterAnalyzer.from_dir(dirpath, prefix="GaAs_")
print(lobana)

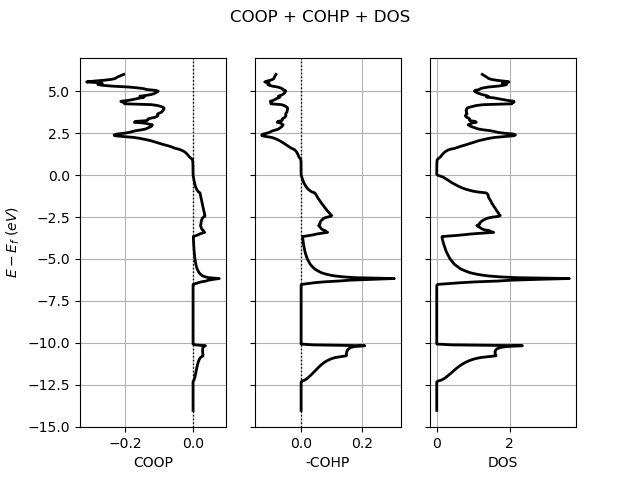
# Plot COOP + COHP + DOS.
lobana.plot(title="COOP + COHP + DOS")

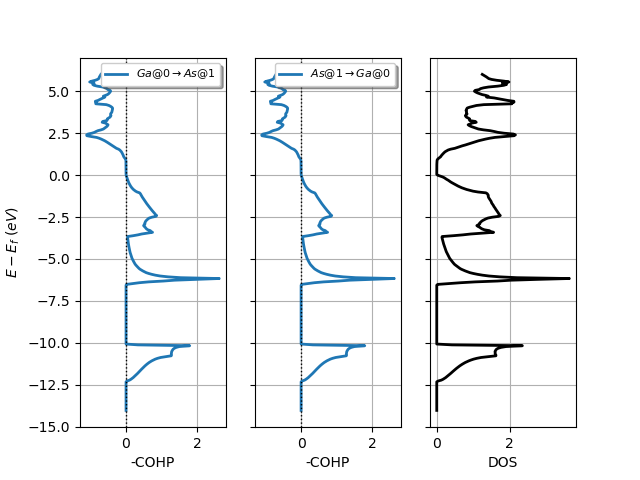
# Plot COHP for all sites in from_site_index and Lobster DOS.
lobana.plot_coxp_with_dos(from_site_index=[0, 1])

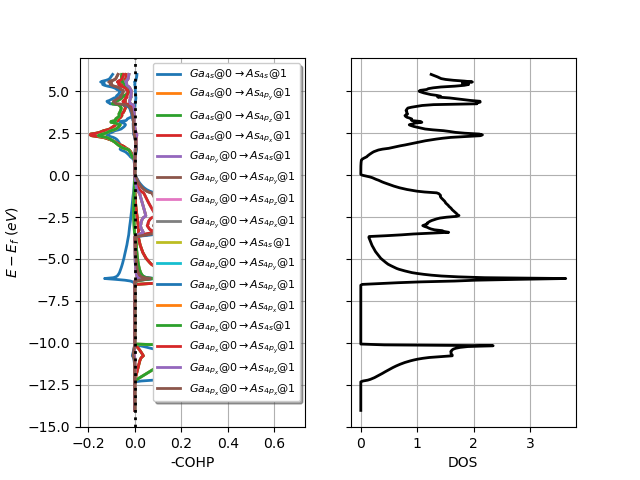
# Plot orbital projections.
lobana.plot_coxp_with_dos(from_site_index=[0], with_orbitals=True)

#lobana.plot_with_ebands(ebands="out_GSR.nc")
Total running time of the script: (0 minutes 0.443 seconds)


