Note
Go to the end to download the full example code.
Multiple Structural relaxations
This example shows how to analyze the results of multiple structure relaxations with the HIST robot.
               formula  natom  ...  initial_fstd  initial_drift
sic_relaxation  Si1 C1      2  ...           0.0            0.0
same_hist       Si1 C1      2  ...           0.0            0.0

[2 rows x 26 columns]
import abipy.data as abidata
from abipy import abilab
files = [
abidata.ref_file("sic_relax_HIST.nc"),
abidata.ref_file("sic_relax_HIST.nc"),
]
# Build HIST robot from paths, use user-selected labels.
robot = abilab.HistRobot.from_files(files, labels=["sic_relaxation", "same_hist"])
# Get dataframe with most important results.
print(robot.get_dataframe())
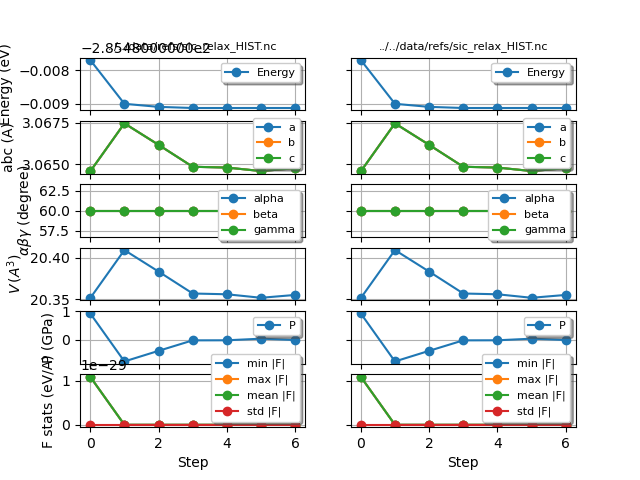
robot.gridplot()
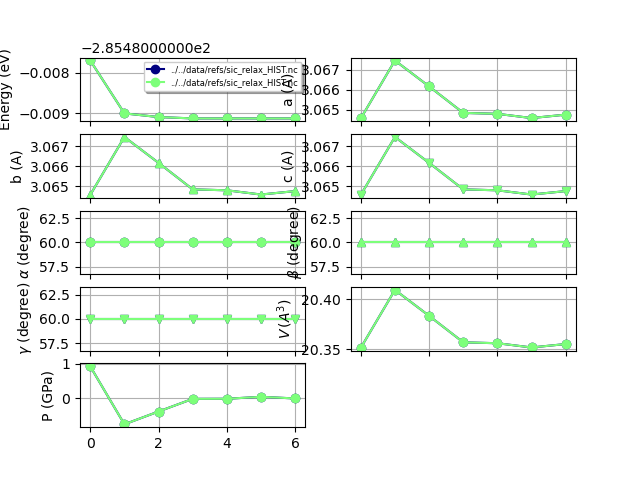
# Use combiplot to compare the results
# (meaningless in this case as we are using the same HIST file).
robot.combiplot()
Total running time of the script: (0 minutes 0.548 seconds)