Note
Go to the end to download the full example code.
Phonon bands with LO-TO from PHBST.nc
This example shows how to plot the phonon band structure of AlAs including the LO-TO splitting. See also tutorial/lesson_rf2.html
Open PHBST file produced by anaddb and extract the phonon bands object. (alternatively one can use the shell and abiopen.py OUT_PHBST.nc -nb to open the file in a jupyter notebook.
import abipy.data as abidata
from abipy.abilab import abiopen

with abiopen(abidata.ref_file("ZnSe_hex_886.out_PHBST.nc")) as ncfile:
    phbands = ncfile.phbands
Phonon frequencies with non analytical contributions, if calculated, are saved in the anaddb.nc file produced by anaddb. The results should be fetched from there and added to the phonon bands. Notice that all the directions starting from or arriving at gamma that are used in the path should explicitely calculated, even if the values are the same.
phbands.read_non_anal_from_file(abidata.ref_file("ZnSe_hex_886.anaddb.nc"))
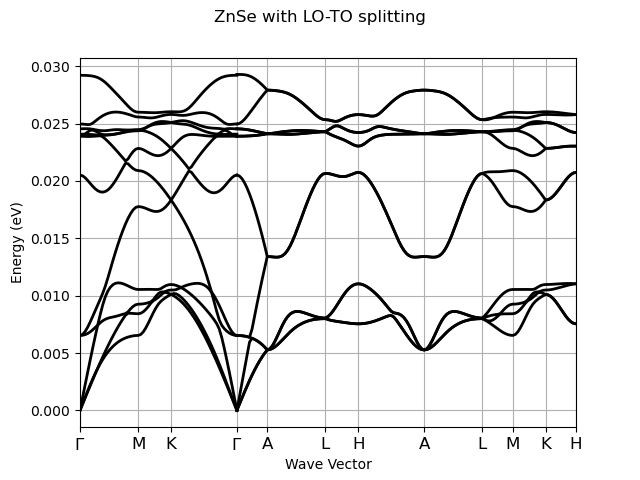
Plot the phonon frequencies. Note that the labels for the q-points are found automatically by searching in an internal database.
phbands.plot(title="ZnSe with LO-TO splitting")
For the plotly version, use:
phbands.plotly(title="ZnSe with LO-TO splitting")
Total running time of the script: (0 minutes 0.416 seconds)