Note
Click here to download the full example code
SIGRES file (GW)ΒΆ
This example shows how to visualize the QP results stored in the SIGRES produced by the GW code (sigma run)
Out:
/Users/gmatteo/git_repos/pymatgen/pymatgen/util/plotting.py:550: UserWarning: Matplotlib is currently using agg, which is a non-GUI backend, so cannot show the figure.
plt.show()
/Users/gmatteo/git_repos/pymatgen/pymatgen/util/plotting.py:550: UserWarning: Matplotlib is currently using agg, which is a non-GUI backend, so cannot show the figure.
plt.show()
/Users/gmatteo/git_repos/pymatgen/pymatgen/util/plotting.py:550: UserWarning: Matplotlib is currently using agg, which is a non-GUI backend, so cannot show the figure.
plt.show()
/Users/gmatteo/git_repos/pymatgen/pymatgen/util/plotting.py:550: UserWarning: Matplotlib is currently using agg, which is a non-GUI backend, so cannot show the figure.
plt.show()
/Users/gmatteo/git_repos/pymatgen/pymatgen/util/plotting.py:550: UserWarning: Matplotlib is currently using agg, which is a non-GUI backend, so cannot show the figure.
plt.show()
import abipy.data as abidata
from abipy.abilab import abiopen
sigres = abiopen(abidata.ref_file("tgw1_9o_DS4_SIGRES.nc"))
# Printout of the QPState results
#sigres.print_qps()
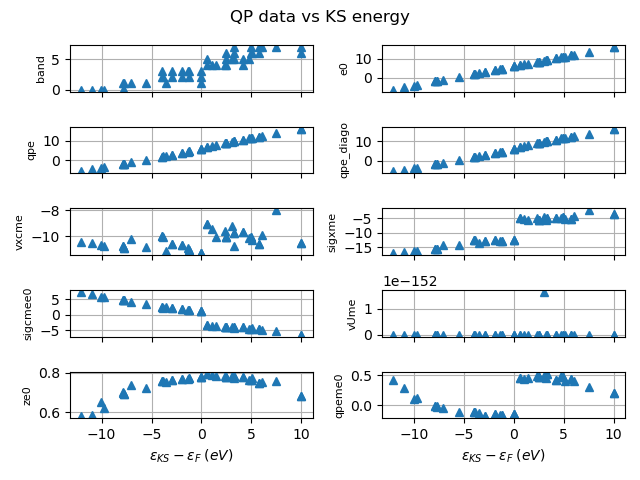
sigres.plot_qps_vs_e0(tight_layout=True, title="QP data vs KS energy")
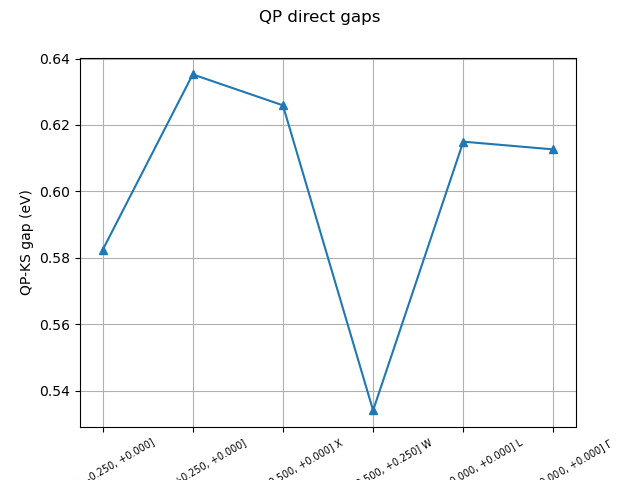
sigres.plot_qpgaps(title="QP direct gaps")
sigres.plot_qpgaps(plot_qpmks=True, title="QP - KS direct gap")
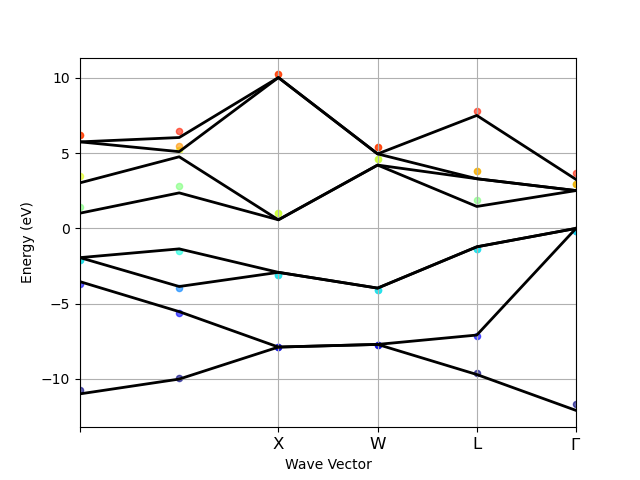
sigres.plot_qpbands_ibz()
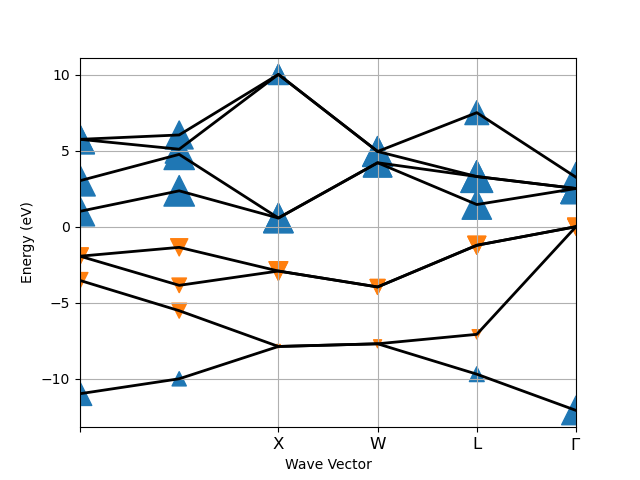
sigres.plot_ksbands_with_qpmarkers(fact=1000)
sigres.close()
Total running time of the script: ( 0 minutes 1.755 seconds)