Note
Go to the end to download the full example code.
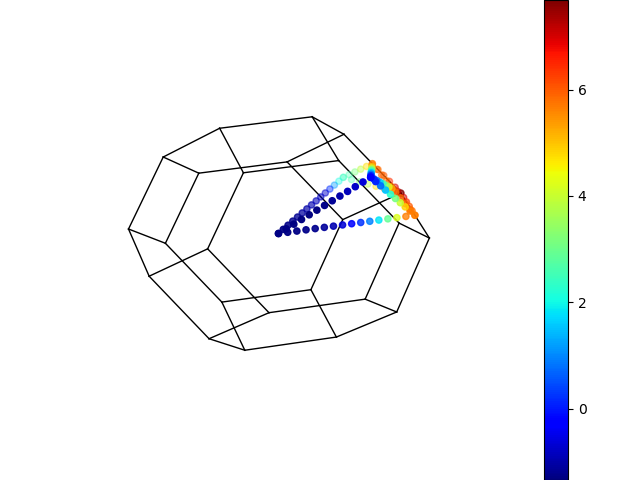
e-bands scatter3d
This example shows how to plot a particular “band” in 3D with matplotlib scatter3D. The color of the point gives the energy of the state wrt to the Fermi level.
import abipy.data as abidata
from abipy import abilab

# Open the GSR file and extract the band structure.
with abilab.abiopen(abidata.ref_file("ni_kpath_GSR.nc")) as ncfile:
    ncfile.ebands.plot_scatter3d(band=9, spin=0)
Total running time of the script: (0 minutes 0.400 seconds)