Note
Go to the end to download the full example code.
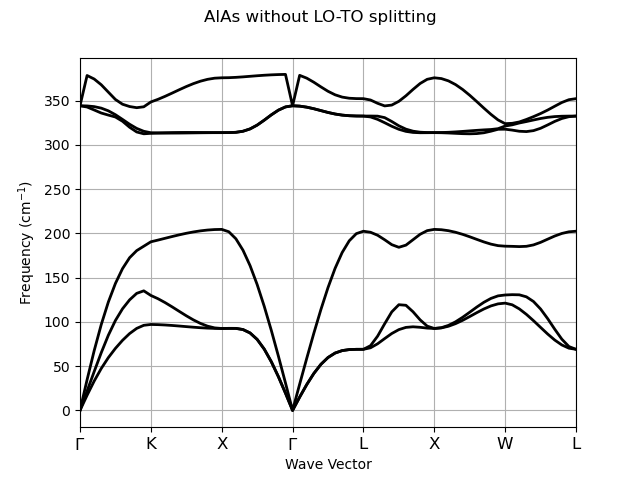
AlAs Phonon bands
This example shows how to plot the phonon band structure of AlAs. See tutorial/lesson_rf2.html
Warning: file /home/runner/work/abipy/abipy/abipy/data/refs/alas_phonons/trf2_5.out_PHBST.nc does not contain atomic_numbers.
Particular methods need them!
import abipy.data as abidata
from abipy.abilab import abiopen
# Open PHBST file produced by anaddb and extract the phonon bands object.
# (alternatively one can use the shell and `abiopen.py OUT_PHBST.nc -nb`
# to open the file in a jupyter notebook.
with abiopen(abidata.ref_file("trf2_5.out_PHBST.nc")) as ncfile:
phbands = ncfile.phbands
# Plot the phonon frequencies. Note that the labels for the q-points
# are found automatically in an internal database.
phbands.plot(units="cm-1", title="AlAs without LO-TO splitting")
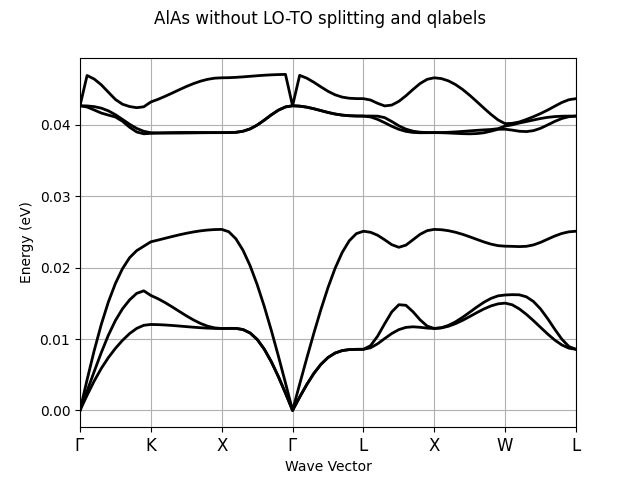
# Alternatively you can use the optional argument qlabels
# that defines the mapping reduced_coordinates --> name of the q-point.
#
qlabels = {
(0, 0, 0): r"$\Gamma$",
(0.375, 0.375, 0.7500): "K",
(0.5, 0.5, 1.0): "X",
(0.5, 0.5, 0.5): "L",
(0.5, 0.0, 0.5): "X",
(0.5, 0.25, 0.75): "W",
}
# and pass it to the plot method:
phbands.plot(title="AlAs without LO-TO splitting and qlabels", qlabels=qlabels)
Total running time of the script: (0 minutes 0.472 seconds)