Note
Go to the end to download the full example code.
Structural relaxation
This example shows how to analyze the results of a structure relaxation using the HIST.nc file.
import abipy.data as abidata
from abipy.abilab import abiopen
Open the HIST file. (alternatively one can use the shell and abiopen.py OUT_HIST.nc -nb to open the file in jupyter notebook.
The structure at the end of the structural relaxation.
print(hist.final_structure)
Full Formula (Si1 C1)
Reduced Formula: SiC
abc   :   3.064763   3.064763   3.064763
angles:  60.000000  60.000000  60.000000
pbc   :       True       True       True
Sites (2)
  #  SP        a     b      c  cartesian_forces
---  ----  -----  ----  -----  -----------------------
  0  C     -0     0     -0     [-0. -0. -0.] eV ang^-1
  1  Si     0.25  0.25   0.25  [-0. -0. -0.] eV ang^-1
min |F_iat|: 0.0 eV/Ang
max |F_iat|: 0.0 eV/Ang
mean F_iat|: 0.0 eV/Ang
std  |F_iat|: 0.0 eV/Ang
Forces are relaxed within high quality criterion: 0.0001 eV/Ang
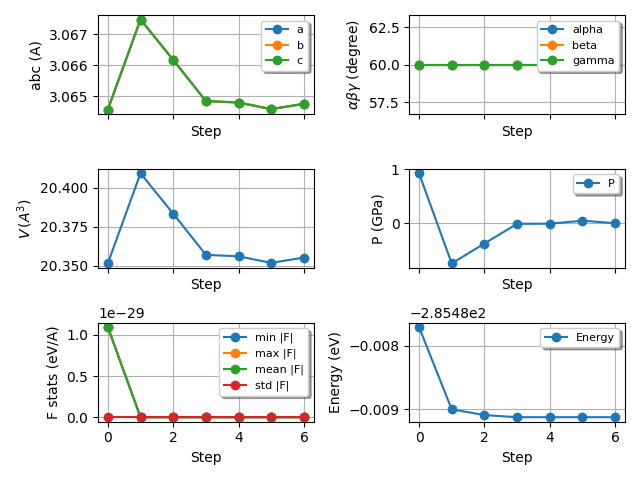
Plot the evolution of the lattice parameters, forces, etotal, etc.
hist.plot(tight_layout=True)
To plot the same results with plotly and the “dark” template, use:
hist.plotly(template="plotly_dark")
# sphinx_gallery_thumbnail_number = 2
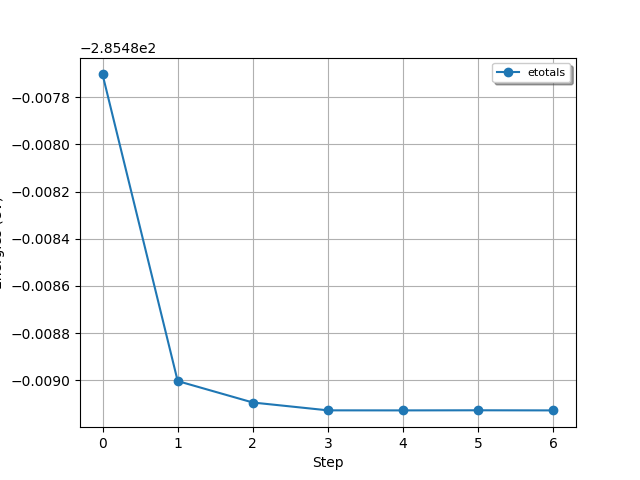
Plot the total energy at the different relaxation steps.
For the plotly version use:
Total running time of the script: (0 minutes 0.368 seconds)