Note
Go to the end to download the full example code.
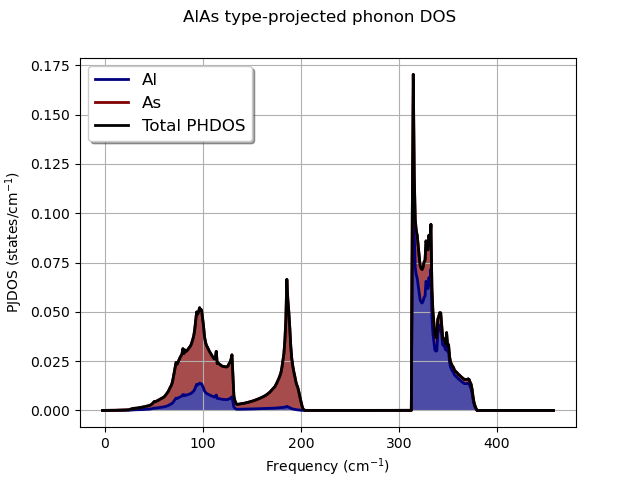
Projected phonon DOS
This example shows how to plot the projected phonon DOS (PJDOS) of AlAs. See tutorial/lesson_rf2.html
Read the Phonon DOS from the netcdf file produced by anaddb with prtdos 2 (alternatively one can use the shell and abiopen.py OUT_PHDOS.nc -nb to open the file in a jupyter notebook.
import abipy.data as abidata
from abipy.abilab import abiopen

phdos_file = abiopen(abidata.ref_file("trf2_5.out_PHDOS.nc"))
To plot the PJDOS with matplotlib, use:
phdos_file.plot_pjdos_type(units="cm-1", title="AlAs type-projected phonon DOS")
For the plotly version, use:
phdos_file.plotly_pjdos_type(units="cm-1", title="AlAs type-projected phonon DOS")
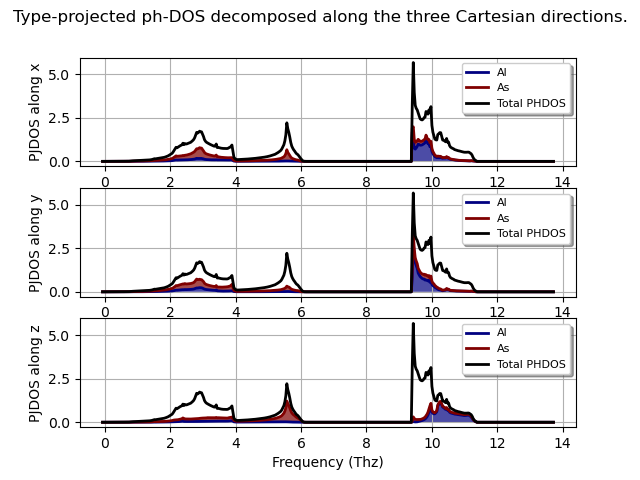
To have the projection along the cartesian directions (summed over atomic types), use
phdos_file.plot_pjdos_cartdirs_type(
    units="Thz", stacked=True, title="Type-projected ph-DOS decomposed along the three Cartesian directions."
)
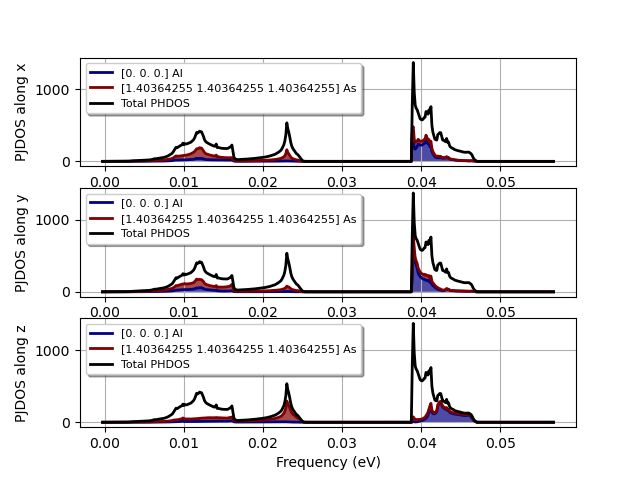
To plot the PJDOS for all the inequivalent sites, use:
phdos_file.plot_pjdos_cartdirs_site(view="inequivalent", stacked=True)
Remember to close the file
Total running time of the script: (0 minutes 0.372 seconds)