Note
Go to the end to download the full example code.
Multiple phonon bands
This example shows how to plot several phonon band structures on a grid.
We use two files produced by anaddb:
- trf2_5.out_PHBST.nc: phonon frequencies on a q-path in the BZ
(used to plot the band dispersion)
trf2_5.out_PHDOS.nc: phonon DOS compute with anaddb.
See also tutorial/lesson_rf2.html
We start by defining a list with the paths to the PHBST.nc files In this case, for simplicity, we use the same file but we must use different labels when adding them to the plotter with the add_phbands method.
import abipy.data as abidata
from abipy import abilab

phbst_paths = 2 * [abidata.ref_file("trf2_5.out_PHBST.nc")]

plotter = abilab.PhononBandsPlotter()
plotter.add_phbands("AlAs", phbst_paths[0])
plotter.add_phbands("Same AlAs", phbst_paths[1])
Warning: file /home/runner/work/abipy/abipy/abipy/data/refs/alas_phonons/trf2_5.out_PHBST.nc does not contain atomic_numbers.
Particular methods need them!
Warning: file /home/runner/work/abipy/abipy/abipy/data/refs/alas_phonons/trf2_5.out_PHBST.nc does not contain atomic_numbers.
Particular methods need them!
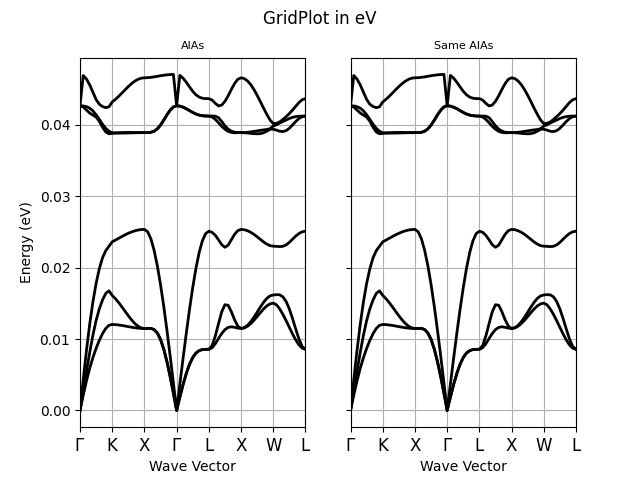
At this point, we can use the plotter methods to plot the data: To produce a grid plot:
plotter.gridplot(units="eV", title="GridPlot in eV")
For the plotly version, use:
plotter.gridplotly(units="eV", title="GridPlotly in eV")
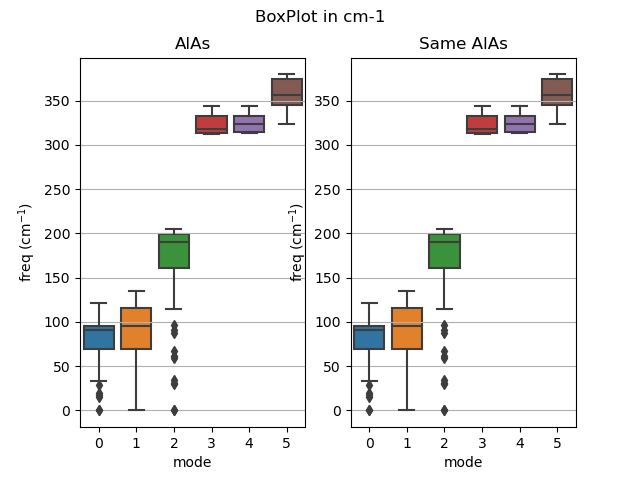
To produce a box plot with matplotly, use:
plotter.boxplot(units="cm-1", title="BoxPlot in cm-1")
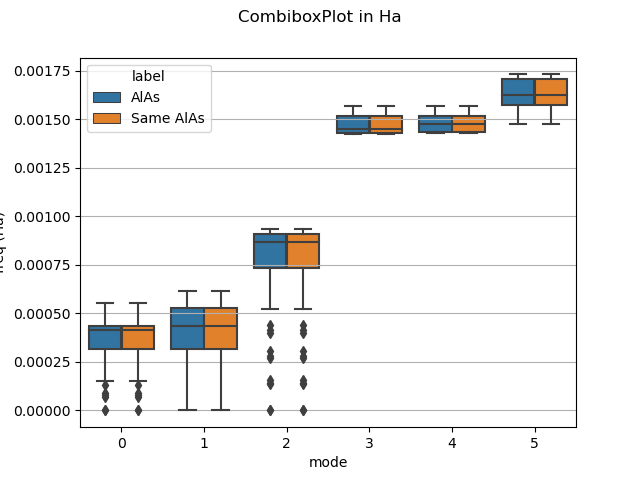
plotter.combiboxplot(units="Ha", title="CombiboxPlot in Ha")
# plotter.boxplotly(units="eV", title="GridPlot in eV")
# plotter.combiplot(title="CombiPlot in eV")
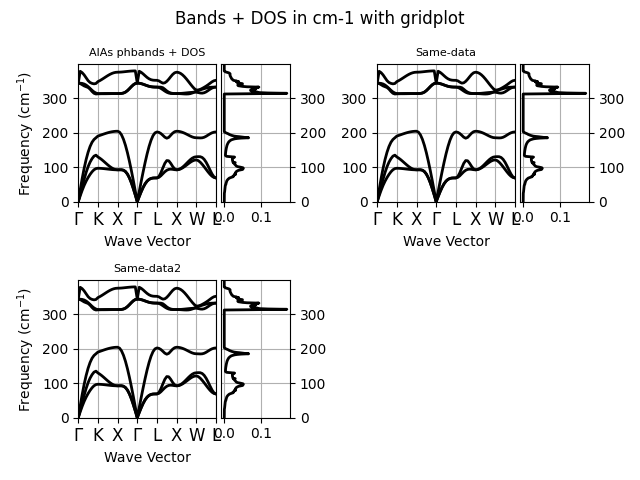
To plot a grid with band structures + DOS, use the optional argument phdos of add_phbands The first subplot gets the band dispersion from phbst_paths[0] and the dos from phdos_paths[0]
phbst_paths = 3 * [abidata.ref_file("trf2_5.out_PHBST.nc")]
phdos_paths = 3 * [abidata.ref_file("trf2_5.out_PHDOS.nc")]

plotter = abilab.PhononBandsPlotter()
plotter.add_phbands("AlAs phbands + DOS", phbst_paths[0], phdos=phdos_paths[0])
plotter.add_phbands("Same-data", phbst_paths[1], phdos=phdos_paths[1])
plotter.add_phbands("Same-data2", phbst_paths[2], phdos=phdos_paths[2])
Warning: file /home/runner/work/abipy/abipy/abipy/data/refs/alas_phonons/trf2_5.out_PHBST.nc does not contain atomic_numbers.
Particular methods need them!
Warning: file /home/runner/work/abipy/abipy/abipy/data/refs/alas_phonons/trf2_5.out_PHBST.nc does not contain atomic_numbers.
Particular methods need them!
Warning: file /home/runner/work/abipy/abipy/abipy/data/refs/alas_phonons/trf2_5.out_PHBST.nc does not contain atomic_numbers.
Particular methods need them!
To visualize the results on a grid with matplotlib, use:
plotter.gridplot(units="cm-1", tight_layout=True, title="Bands + DOS in cm-1 with gridplot")

# plotter.combiplot(title="Bands + DOS in eV with combiplot")
For the plotly version:
plotter.gridplotly(units="cm-1", title="Bands + DOS in cm-1 with gridplot")
Total running time of the script: (0 minutes 2.186 seconds)