Note
Go to the end to download the full example code.
Eliashberg function
This example shows how to plot the Eliashberg function a2F(w) and the total e-ph coupling strenght in metals.
import abipy.data as abidata
from abipy import abilab
a2file = abilab.abiopen(abidata.ref_file("al_888k_161616q_A2F.nc"))
# print(a2file)
# a2file.phbands.plot()
# a2file.a2f_qintp.plot()
# with_lambda = False
# fig = a2file.a2f_qcoarse.plot_nuterms(with_lambda=with_lambda, show=False)
# a2file.a2f_qintp.plot_nuterms(axmat=fig.axes, with_lambda=with_lambda)
# a2file.plot()
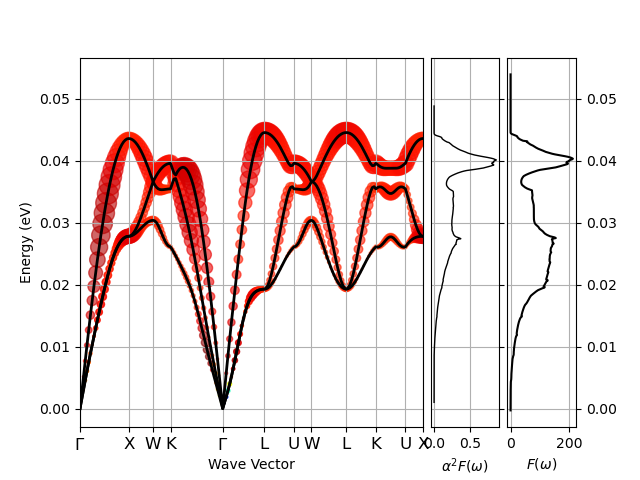
phdos_path = abidata.ref_file("al_161616q_PHDOS.nc")
a2file.plot_with_a2f(phdos=phdos_path)
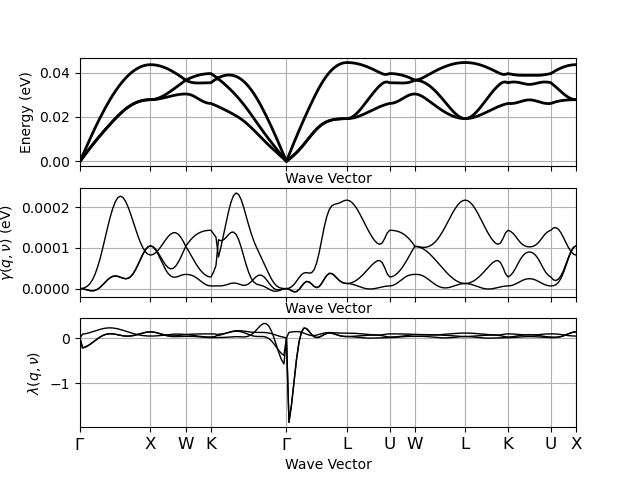
a2file.plot_eph_strength(what="gamma")
# a2file.plot_eph_strength(what="lambda")
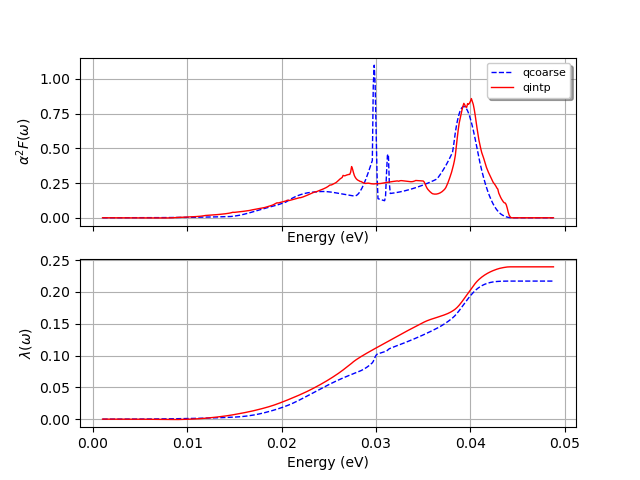
a2file.plot_a2f_interpol()
# Grid with 3 plots (a2F, F, a2F) with F taken from PHDOS file.
# a2file.a2f_qintp.plot_a2(phdos_path)
Total running time of the script: (0 minutes 2.798 seconds)