Note
Go to the end to download the full example code.
Multiple phonon bands with DDB robot
This example shows how to plot several phonon band structures on a grid.
Important
Note that a manager.yml file and an abinit installation are required to run this script as AbiPy needs to invoke anaddb to compute phonons from the DDB file.
We start by defining a list of DDB files: obtained with the same structure but different k-mesh and tmear:
import os

import abipy.data as abidata
from abipy import abilab

paths = [
    # "mgb2_444k_0.01tsmear_DDB",
    # "mgb2_444k_0.02tsmear_DDB",
    # "mgb2_444k_0.04tsmear_DDB",
    "mgb2_888k_0.01tsmear_DDB",
    # "mgb2_888k_0.02tsmear_DDB",
    "mgb2_888k_0.04tsmear_DDB",
    "mgb2_121212k_0.01tsmear_DDB",
    # "mgb2_121212k_0.02tsmear_DDB",
    "mgb2_121212k_0.04tsmear_DDB",
]

paths = [os.path.join(abidata.dirpath, "refs", "mgb2_phonons_nkpt_tsmear", f) for f in paths]
Now we initialize the DdbRobot from this list of paths:
robot = abilab.DdbRobot.from_files(paths)
print(robot.keys())
dict_keys(['../../data/refs/mgb2_phonons_nkpt_tsmear/mgb2_888k_0.01tsmear_DDB', '../../data/refs/mgb2_phonons_nkpt_tsmear/mgb2_888k_0.04tsmear_DDB', '../../data/refs/mgb2_phonons_nkpt_tsmear/mgb2_121212k_0.01tsmear_DDB', '../../data/refs/mgb2_phonons_nkpt_tsmear/mgb2_121212k_0.04tsmear_DDB'])
Now we change the keys associated to the different files by defining a function that computes the new label from the info reported in the ddb object. These lables are then used to generate the legend in the matplotlib plot.
robot.remap_labels(lambda ddb: "nkpt: %s, tsmear: %.2f" % (ddb.header["nkpt"], ddb.header["tsmear"]))
print(robot.keys())
dict_keys(['nkpt: 256, tsmear: 0.01', 'nkpt: 256, tsmear: 0.04', 'nkpt: 864, tsmear: 0.01', 'nkpt: 864, tsmear: 0.04'])
Invoke anaddb to build a PhononBands plotter. We use a small q-mesh for the ph-DOS to speedup the computation:
r = robot.anaget_phonon_plotters(nqsmall=2)
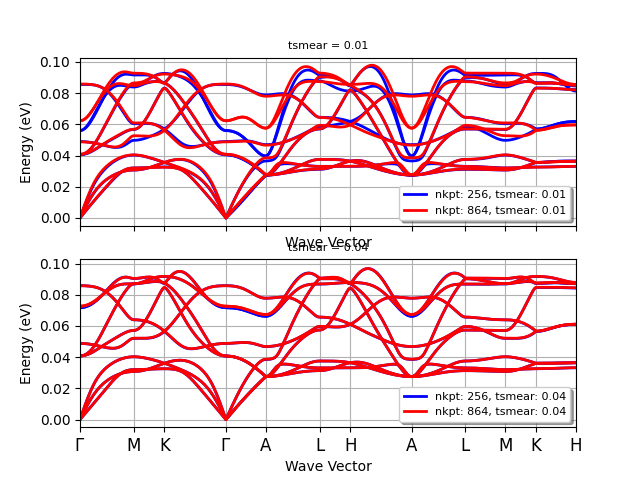
To group the results by tsmear use:
r.phbands_plotter.gridplot_with_hue("tsmear")
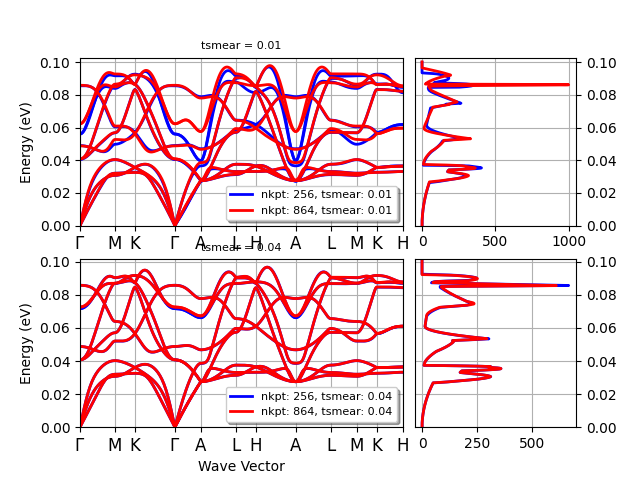
If Phonon DOSes are wanted, use:
r.phbands_plotter.gridplot_with_hue("tsmear", with_dos=True)

# r.phbands_plotter.gridplot()

robot.close()
Total running time of the script: (0 minutes 6.488 seconds)