Note
Click here to download the full example code or to run this example in your browser via Binder
Unit cell
This example shows how to display the unit cell with matplotlib.
from abipy.abilab import abiopen
import abipy.data as abidata
Extract structure from the netcdf file:
with abiopen(abidata.ref_file("sio2_kpath_GSR.nc")) as gsr:
    structure = gsr.structure
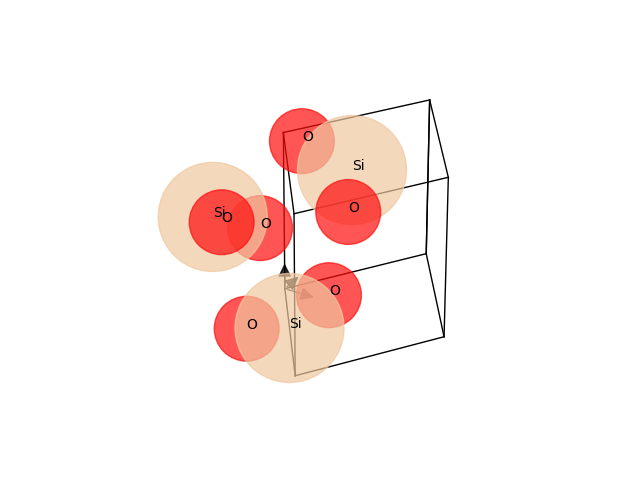
To visualize the structure with matplotlib, use:
structure.plot(color_scheme="Jmol")
Out:
<Figure size 640x480 with 1 Axes>
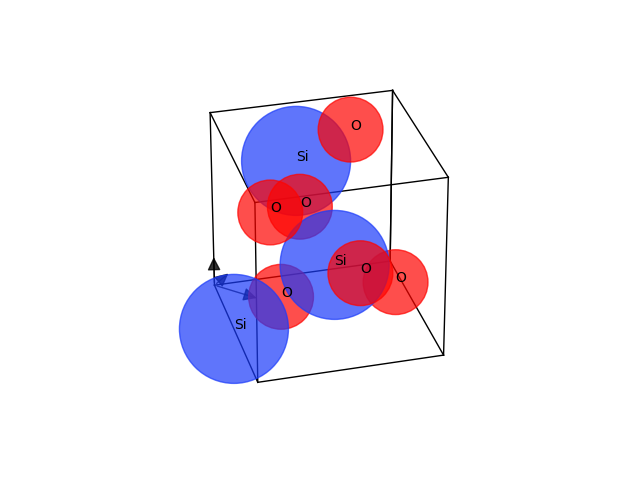
To wrap sites into first unit cell, use:
# sphinx_gallery_thumbnail_number = 2
structure.plot(to_unit_cell=True)
Out:
<Figure size 640x480 with 1 Axes>
Total running time of the script: ( 0 minutes 0.258 seconds)